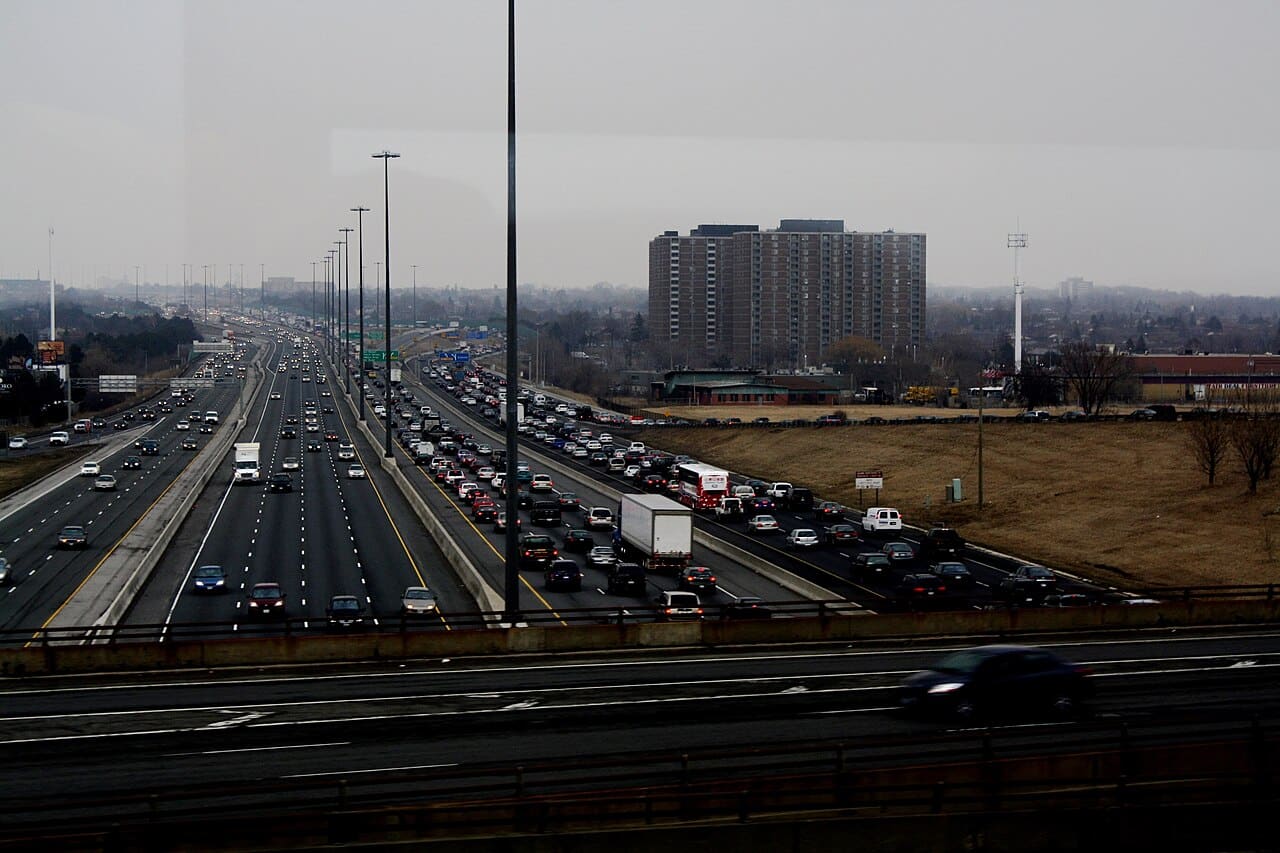
The light turns green and nothing moves.
A minute passes, then two. The car ahead inches forward half a length and stops again. For millions of American drivers, this is Tuesday. And Wednesday. And most of Thursday. What almost nobody calculates, in the moment, is what that stillness is actually worth in dollars.
How gridlock converts your time directly into money lost
Traffic congestion occurs when demand for road travel exceeds the supply of roadway, and as traffic builds, drivers, freight movers and bus riders lose time and burn fuel unproductively. The economic accounting is straightforward: every hour spent creeping through a jam is an hour that cannot be spent working, resting or earning.
Transportation analysts convert those hours into dollars by applying a standard hourly value of time, derived from Federal Highway Administration guidance and adjusted for inflation, turning what feels like frustration into a precise, auditable financial loss. The lost-time figure is calculated as the difference between travel times during peak periods and travel times during free-flow conditions, rush hour versus driving at night with little traffic.
That gap, multiplied across every rush-hour trip every driver makes in a year, is the hidden toll nobody sees on any toll-road sign. And it has been climbing steadily as more workers make the daily trip back to their desks.
What the numbers look like city by city across America
On average, the typical US driver lost 49 hours to congestion in 2025, up six hours from the year before, costing roughly $894 per person in lost time. Combined, that works out to at least $85.8 billion nationally, a figure that does not include costs to trucking or congestion outside peak periods.
To put it in perspective, $85.8 billion is roughly equal to the entire US Department of Transportation’s annual budget in recent years, a department responsible for roads, rail, aviation and maritime infrastructure across the country.
Chicago, New York, Philadelphia, Los Angeles and Boston rank as the most congested cities in the country. Chicago took the top spot in the national ranking after New York held it the previous year. Drivers there lost 112 hours to traffic in 2025, up 10 percent in a single year, working out to $2,063 per driver.
Philadelphia’s rise was even more startling. Its traffic jumped 31 percent in a single year, among the biggest spikes of any major city in the top 25, with drivers going from roughly 77 hours lost to 101. Meanwhile, the average New York driver is still out roughly $1,879 a year, even after the city launched its cordon pricing program, which held congestion flat while it surged in almost every other US metro.
Where the scorecard data comes from and what it measured
INRIX, a global leader in transportation data and analytics, released the 2025 Global Traffic Scorecard on December 1, 2025, spanning 36 countries and nearly 1,000 cities. It reveals a world where congestion is climbing almost everywhere, with London, Paris and New York the rare exceptions among major cities. Los Angeles also posted a slight decline. Nearly every other major US metro moved in the wrong direction.
Of the 290 US cities analyzed, congestion increased in 88 percent of them. The company measured changes in average peak-period travel times from 2023 through Q3 of 2025, with fourth-quarter estimates calculated from historical and seasonal trends. For anyone already watching their spending carefully, that $894 annual drain is a significant line item that never appears on any bank statement.
Across the country, drivers lost around 4.7 billion hours to traffic last year, equal to roughly 2.2 million full-time jobs worth of productivity. INRIX transportation analyst Bob Pishue notes that “congestion is going up and the infrastructure struggles to keep up.” Return-to-office trends are identified in the scorecard as a key factor, with peak congestion windows wider than they were before the pandemic.
That figure makes the congestion bill one of the largest silent productivity drains in the American economy, sitting alongside workplace disengagement costs that researchers have also recently put a precise dollar value on.
Where the numbers do not hold and which drivers escape the worst
The national average of $894 conceals enormous variation. A driver in a mid-sized Sun Belt city with short peak windows and wide arterials might lose far fewer than 49 hours. More than three-quarters of people in US cities commute by car, with just 13 percent working from home and 4 percent using public transit.
The car-dependence of most American metros is precisely what makes the congestion math so punishing.
Public transit offers a partial escape, but its recovery has stalled. Ridership is still down roughly 20 percent from pre-pandemic levels, and remote work continues to compete with transit as an alternative to driving. Hybrid schedules dull the blade but do not remove it, since many remote-capable workers still show up on some days and add to peak-hour volume.
What happens next as cities weigh pricing, transit and road capacity
New York’s congestion pricing result is the most-watched policy experiment in urban transport right now. New York saw no growth in delay, signaling that congestion pricing, though geographically a relatively small area, may be a factor. Other cities may pursue similar pricing, and some form of vehicle-miles-traveled fee has already appeared in long-range transportation plans at the local level.
The news arrives as the Highway Trust Fund continues to operate in the red. By 2029, the Congressional Budget Office estimates the fund’s expenditures could exceed its dedicated revenues by about $40 billion in that fiscal year. More congestion compounds that gap, since idling engines burn more fuel for fewer miles, eroding the per-gallon tax base that funds road repair.
The path forward is unlikely to be a single fix. Signal coordination, bus priority, priced lanes and housing near job centers can all reduce delay when matched to the right local problem. For the average commuter sitting in today’s jam and losing another $18 of their time, the most immediate option may simply be shifting the trip by thirty minutes, before the peak builds and the math turns brutal.
