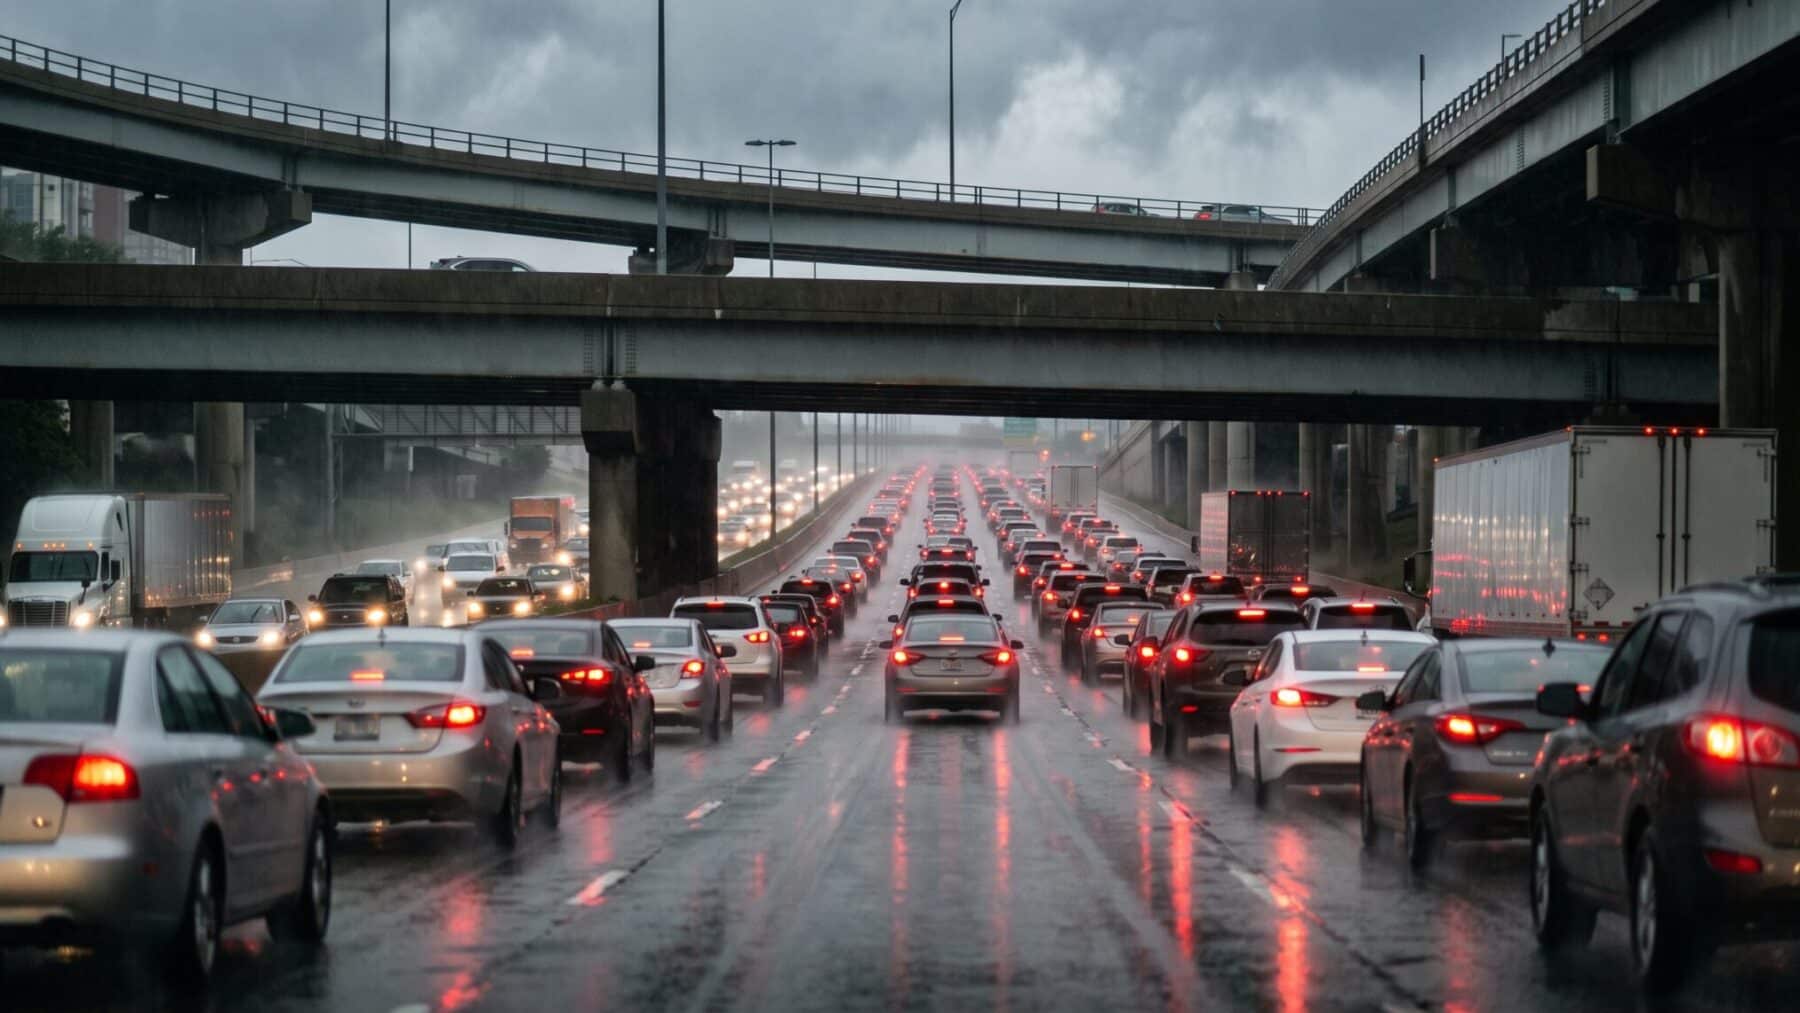
Picture a full work week handed back to nobody.
That is what sitting in gridlock cost the average American driver last year. In Chicago it was 112 hours. The cars barely moved. The meter kept running.
A comprehensive new global mobility scorecard just put a precise dollar figure on all of it. The number is uncomfortable. And what keeps it climbing reveals something most commuters have never quite added up.
Why the clock on your dashboard is also a cash register draining hundreds of dollars a year
Economists treat time as a resource with a market value. When a driver sits motionless on an expressway, that hour cannot be spent working or earning anything. Transportation analysts assign it a dollar value based on prevailing wage rates, then multiply by the total hours lost across every driver in a metro area.
That math compounds fast. Fuel burns faster at idle than at highway speed, so every minute of stop-and-go adds a direct gas cost on top of the time cost.
The worse traffic gets, the more both figures climb together, which is why the national bill can reach a figure that sounds like it belongs in a federal budget rather than a morning commute.
What the gridlock actually looks like, city by city, from the Windy City to the City of Brotherly Love
The scorecard ranked Chicago as the most congested US city, overtaking New York City for the top spot. Chicago drivers lost 112 hours and paid $2,063 each. New York City followed at 102 hours, Philadelphia at 101, Los Angeles at 87 and Boston at 83.
New York, meanwhile, held flat. The city’s congestion pricing policy is a likely factor, and that flat line is the exception among the largest metros. US cities overall saw gridlock rise in 254 of the 290 cities analyzed as travel returned to pre-pandemic levels.
Philadelphia’s swing was among the sharpest of any major city. Drivers there posted one of the largest year-over-year congestion increases, alongside Baltimore, of any major city in the scorecard, a 31% jump in a single year. The per-driver cost for New York landed at $1,879. For anyone in the Philadelphia suburbs who felt their commute suddenly get brutal, the data confirms it was not imagined.
Where the $85.8 billion national figure comes from and what the scorecard actually measured
American drivers lost 49 hours on average, up six hours from the prior year, costing the nation $85.8 billion in lost time. That figure covers only the value of time lost during peak periods and excludes the added cost to freight and trucking networks, so the true economic drag is higher still.
The 2025 INRIX Global Traffic Scorecard covers nearly 1,000 cities across 36 countries and pins its dollar value to time actually spent in peak-period traffic, using observed trip data rather than modeled estimates. Real trips, real delays, real cost.
Bob Pishue, the transportation analyst behind the scorecard, has noted that congestion is no longer a big-city problem alone, as mid-size metros are now posting losses that would have been unthinkable a decade ago.
The $894 national average per driver sits well below the big-city figures because smaller metros pull it down. Drivers in America’s most congested corridors are paying two to three times that average without ever thinking of it as an annual bill.
The two structural forces making congestion harder to escape even for drivers who think they have already adapted
Return-to-office pressures pushed car volumes back up, with the percentage of people commuting by car nearly back to 2019 levels. The roads, however, did not absorb that shift smoothly.
Public transit has not made an equivalent recovery and remains 22% below pre-pandemic levels, according to the INRIX scorecard. That gap is a driver of the problem. Millions of riders who once took trains and buses have not fully returned, so those trips shifted onto the road network.
Rising housing costs are pushing workers farther from job centers, adding miles to already-strained corridors. In the most recent Census data, 69.2% of US workers drove alone to work, while just 3.7% used public transportation.
The busiest US corridor in the scorecard sits on I-95 southbound in Stamford, Connecticut, where commuters lost 133 hours annually. That single stretch captures exactly how a regional housing squeeze translates directly into a daily time tax.
What cities are testing now, and why the answers that work in one place can collapse in another
New York’s congestion pricing result is the clearest proof yet that pricing road access works. But that policy is politically difficult to replicate in cities built around surface roads rather than dense urban cores, which is most of America.
Transit investment is the other lever, though those projects take years to deliver and depend on ridership actually shifting back. Even a meaningful transit recovery would not undo the current congestion picture quickly. Americans who live in walkable neighborhoods absorb almost none of this cost, which helps explain why that preference has become so financially rational.
There is a quieter personal calculation most commuters have not run. Negotiating a hybrid schedule for just two days at home per week cuts the annual hours-and-fuel bill substantially in any congested metro.
Add up the hours at average wage and the real cost of a five-day commute in a congested metro often exceeds the salary gap between competing job offers. For anyone weighing a move or talking to an employer about remote flexibility, the math is now firmly on the table.
