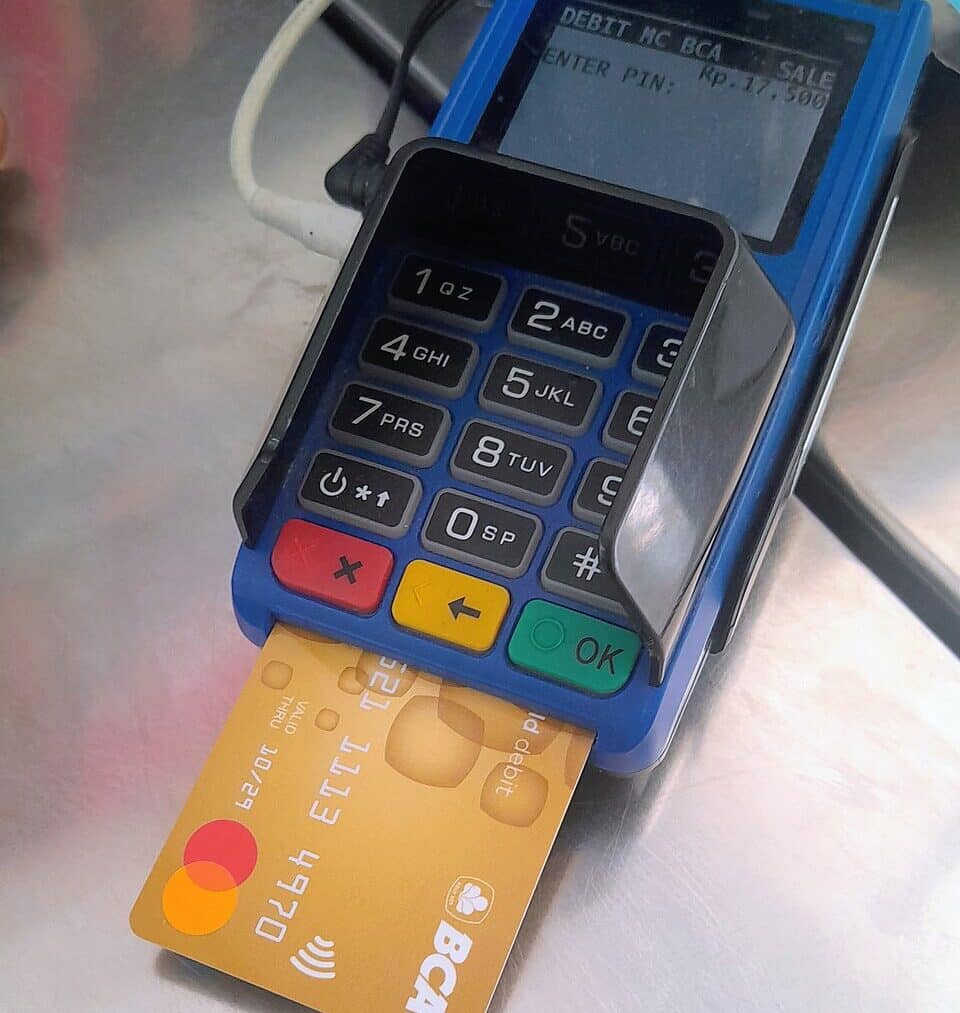
A card reader flips around at the counter, its screen already glowing with three fat percentages.
Nobody asked for that number to be there.
It was chosen months earlier, in a back office, by someone who had already seen what happens next.
Shoppers tap one of the buttons without thinking twice.
Researchers who went looking at real receipts found that choice is doing far more than anyone standing at the register realizes.
How the number on the screen quietly decides the tip before you do
Every digital tip screen runs on the same trick: it presents a small menu of percentages, usually three, and lets the lowest one on that menu act as the anchor for the whole decision. Pick a floor of 10 percent, and most people hover near the middle option.
Raise that floor to 20 percent, and the same crowd of customers drifts upward without feeling like anything changed. That is the default tip effect, and a large field experiment on tipping run through a major ride hailing app is one of the clearest records of it in action.
The researchers found that tipping levels “as a percent of the fare increase by 2.5% between the lowest and highest default options,” a modest but measurable shift. So the screen is not neutral.
It is a small piece of choice architecture, the same term economists use for grocery store layouts and retirement plan enrollment forms. Whoever sets the floor number is, in a quiet way, setting the outcome for thousands of transactions a day.
That matters because almost nobody studies the three numbers in front of them. Most riders and diners read the menu once, judge it as reasonable or steep, and tap.
Inside the actual data, from cab rides to coffee counters
The same ride-hailing dataset shows how much a small signal can move an average tip, even more than the default screen itself. In that study, the biggest single swing in tip size came from the driver’s own star rating: drivers with a 5-star rating are tipped close to 50% more often than those with a 4.75 rating, and when they do receive tips they are nearly 5% higher . The default-screen effect ran in the same direction, just on a smaller scale, which is why researchers treat both as evidence that small signals on a screen shape what riders hand over.
Multiplied across tens of millions of rides a year, even a modest shift per trip adds up to real money moving from riders’ pockets to drivers’ pay, triggered by nothing more than which numbers happened to load on a screen.
Coffee counters and quick service lines show a related pattern on a smaller scale. A tip menu for a modest bill might suggest two, three or four dollars rather than percentages at all, and patent filings describing how these systems are built show the ranges can shift depending on purchase size.
Most customers never type in a custom number. They pick from the menu they are handed, which means the business setting that menu is effectively choosing the average tip for its own staff.
The hard evidence behind the trend, and where it was measured
This is not a single anecdote dressed up as a trend. A separate study published in the journal Management Science, led by Cornell hospitality researcher Michael Lynn and colleagues, pulled real transaction records rather than lab surveys to test the same question.
A field experiment involving 94,571 orders from 24,637 customers of an app-based laundry pick-up, cleaning, and delivery service examined the effects of various randomly assigned tip recommendations on tip amounts, satisfaction, repeat business and spending. The authors found that larger tip recommendations increase tip amounts but decrease likelihood of tipping when exceeding normative levels . That second half of the finding is the twist most coverage misses.
Pushing the default higher does lift the average tip among people who still tip. But it also pushes a meaningful slice of customers to opt out entirely, skipping the tip rather than facing a menu that starts higher than they planned to give.
Notably, the same study found the opposite of what many assume about backlash: tip recommendations affected tip amounts but not customer satisfaction, patronage frequency, or bill size , suggesting the sting of a high suggested number fades once the transaction is over.
Where the trick breaks down, and why some customers push back
The effect is not limitless. Earlier work on ride-hailing and taxi tipping, including research consonant with the Uber field experiment above, has found a similar pattern: higher default options tend to lead to higher tip levels on average, but they also lead to a higher share of trips that do not get tipped at all.
Diners who feel nudged into a number larger than they intended report the experience differently afterward than diners who typed in their own figure, at least anecdotally, even if the laundry-service data above did not find a measurable dent in satisfaction. That friction shows up most in the running conversation around the practice, not necessarily in the hard numbers.
Coverage of the broader “tipping fatigue” trend has documented point-of-sale screens that suggest higher minimum tips, often starting at 18 or even 20 percent , with some screens pushing as high as 30 percent at counters that never required tipping before, and researchers and industry writers describing the same anchoring mechanism seen in the academic studies above.
That pattern matters because it shows the system is designed to absorb its own backlash. Some customers get annoyed and tip nothing. Enough others simply tap the higher number anyway that the business can still come out ahead on average.
It is also why some researchers now argue for a different fix: let people adjust their tip privately after the transaction rather than under a cashier’s gaze.
What this means the next time you tap a tip screen
None of this makes the screen dishonest. The percentages are real options, and nobody is forced to pick the highest one. But knowing the floor of the menu was chosen to pull the average upward changes how a shopper might read it.
That is the same way knowing a grocery store put candy at checkout height changes how a parent reads that aisle. This connects to a broader pattern this desk has tracked all year in how small interface choices shape ordinary spending.
From the way checkout splits a bill into smaller pieces to the way a pause before paying changes how happy a buyer feels, tip screens belong in that same family of tiny design decisions.
The fairest takeaway from the research is not that tipping screens are a trap. It is that the number glowing on the reader reflects a choice someone else made, long before any customer walked up. Reading that number with a little skepticism costs nothing.
