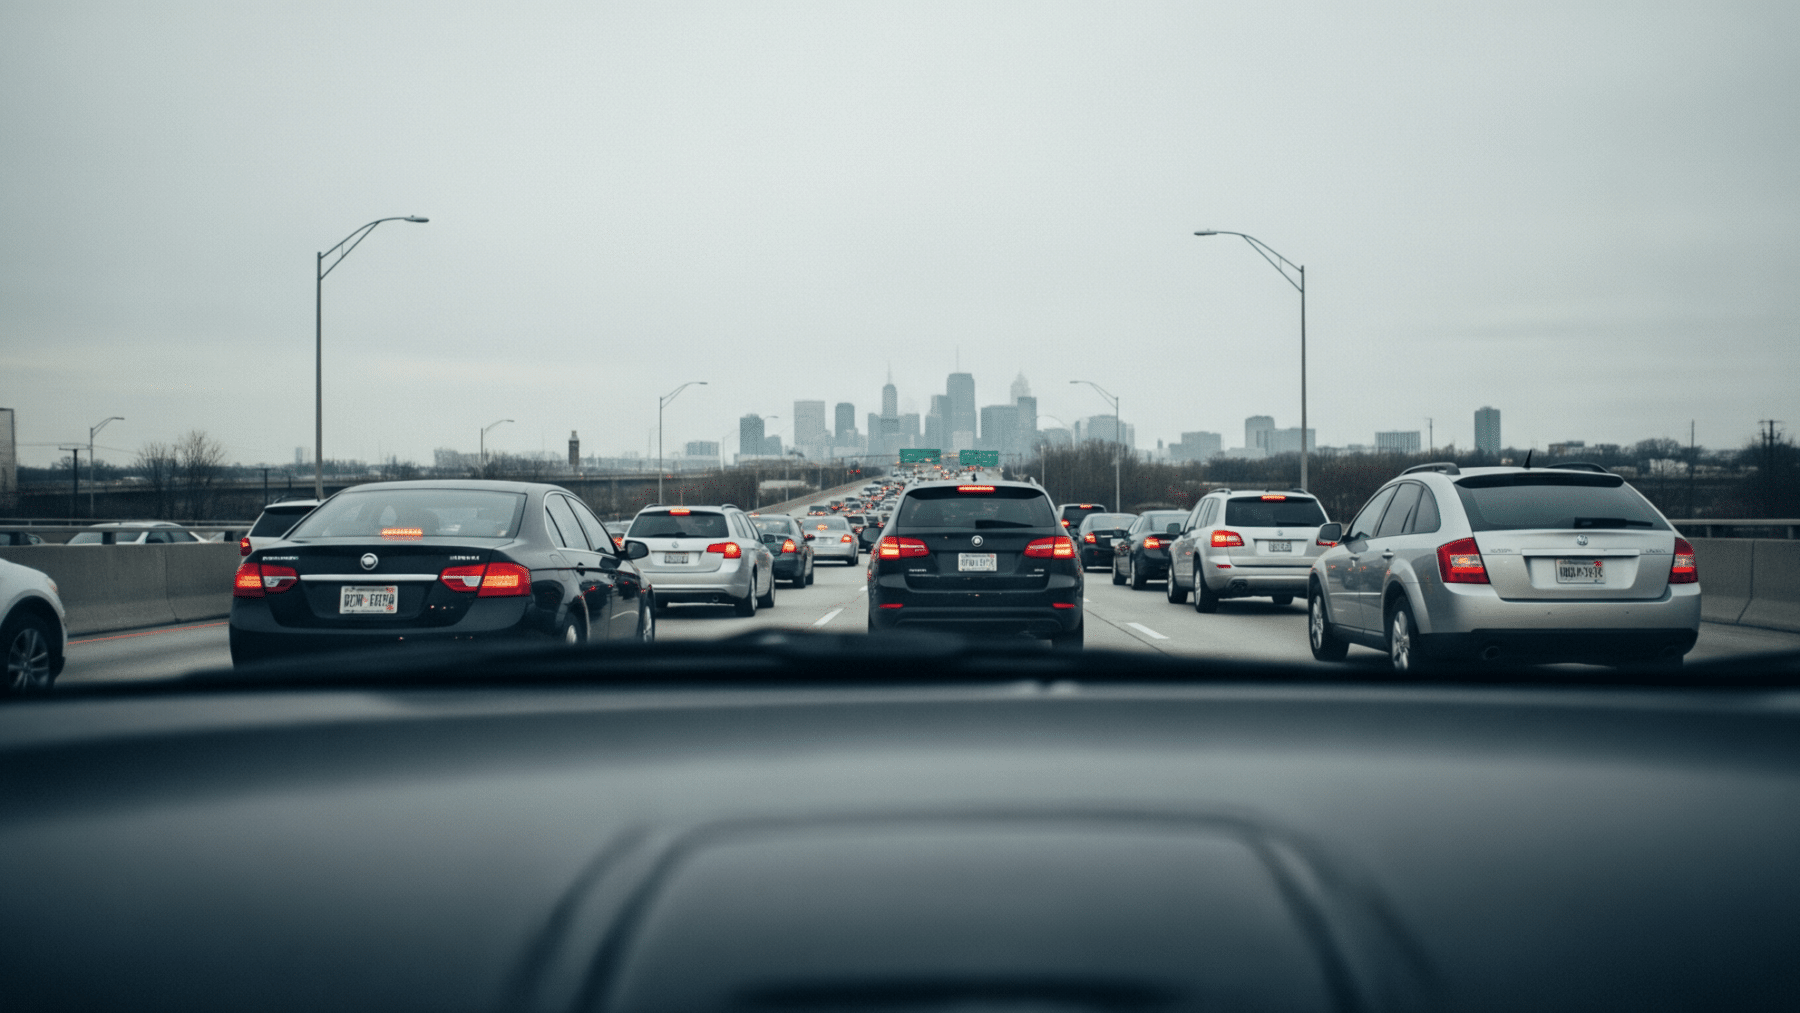
Every weekday morning, millions of Americans slide into the driver’s seat, back out of the driveway, and join the crawl toward work. The trip feels routine. It also carries a hidden price tag that most drivers have never once added up.
Nobody sends you an invoice for the time you lose sitting in traffic. That is exactly what makes it so easy to ignore, and so expensive.
The everyday ritual that quietly drains your wallet without you noticing
Most people think of a commute as free once the car is paid for and the gas tank is full. That framing misses the most significant cost: time itself.
Transportation analytics firm INRIX is a global leader in transportation data and analytics. Its annual scorecard spans 36 countries and nearly 1,000 cities, revealing a world where congestion is climbing almost everywhere.
To compile its annual scorecard, INRIX measured and analyzed congestion using anonymized, aggregated GPS trip data along with mobile devices, connected vehicles, and fleet data to track commutes and calculate average travel speeds under both congested and free-flow conditions.
The result is a number that most drivers would rather not see.
How researchers turn lost minutes into a dollar amount most commuters never calculate
To estimate the economic cost of traffic, INRIX applied inflation-adjusted hourly values of time as outlined by the United States Federal Highway Administration. That methodology transforms every red light, every merge, and every inexplicable slowdown into an entry on a ledger most people never open.
The math is straightforward even if the result is quietly alarming. Every additional minute spent not moving is a minute of your working life that someone else effectively spent for you, only no one paid you for it.
And those minutes, it turns out, stack up far faster than most people expect over the course of a full year. At a time when more than four in five Americans are tracking their spending more closely, this is one cost that rarely shows up in any budget app.
The national number that landed quietly and the cities where it hurts far worse than average
American drivers lost 49 hours in 2025, up six hours from the year before, costing the nation $85.8 billion in lost time.
The typical U.S. driver lost 49 hours to traffic congestion, an 11% increase from 2024, which amounts to $894 in lost time per driver. That is more than a full work week handed over to gridlock that produced nothing.
The $85.8 billion national figure does not even include the cost to trucking and congestion outside of peak periods. The true toll on the economy is almost certainly higher.
For drivers already worried about stretching a household budget that keeps getting squeezed, $894 a year is not a trivial line item, it is close to a car payment.
Chicago reclaimed the top U.S. spot it had shared with New York, and the reason one city held flat tells the whole story
Here is the reveal that most drivers in one American city did not see coming: according to the 2025 Global Traffic Scorecard, last year Chicago had tied with New York City for the number-one spot in the U.S., but Chicago is now alone at the top, thanks in part to NYC implementing a congestion surcharge in Manhattan.
Drivers in Chicago lost 112 hours to traffic jams in 2025, costing the average driver $2,063. That is more than twice the national average cost, extracted from every Chicago commuter whether they noticed it or not.
Chicago took the top U.S. spot at 112 hours lost in 2025, up 10% from 2024, while New York’s congestion remained unchanged.
Congestion levels in New York City remained flat in 2025, and the city’s new congestion pricing policy is a likely factor in its control of traffic congestion.
A single toll policy held one of the world’s densest cities steady while 88% of the 290 U.S. cities analyzed saw congestion increase.
Philadelphia’s traffic jumped 31% in a single year, the biggest spike of any major city, rocketing from fifth place to third, with drivers going from losing 77 hours to 101.
What the scorecard’s quiet arithmetic says about where cities go from here
Rising housing costs are pushing many workers farther from job centers, contributing to the rise of so-called “super commutes.” Billions in infrastructure spending have struggled to keep pace with demand.
The percentage of people commuting by car is nearly back to 2019 levels, while public transit has not made the same recovery and is down 22% from 2019.
More cars on the same roads, with fewer riders sharing the load on trains and buses, is a compounding equation.
The New York data point offers a tangible counterweight: congestion in London, Paris, and New York City remained at current levels or even decreased in 2025. The tool exists.
The question cities now face is whether the political will to use it catches up with an $85.8 billion annual bill that every driver is already paying, just never all at once, and never on a single line of any invoice.
