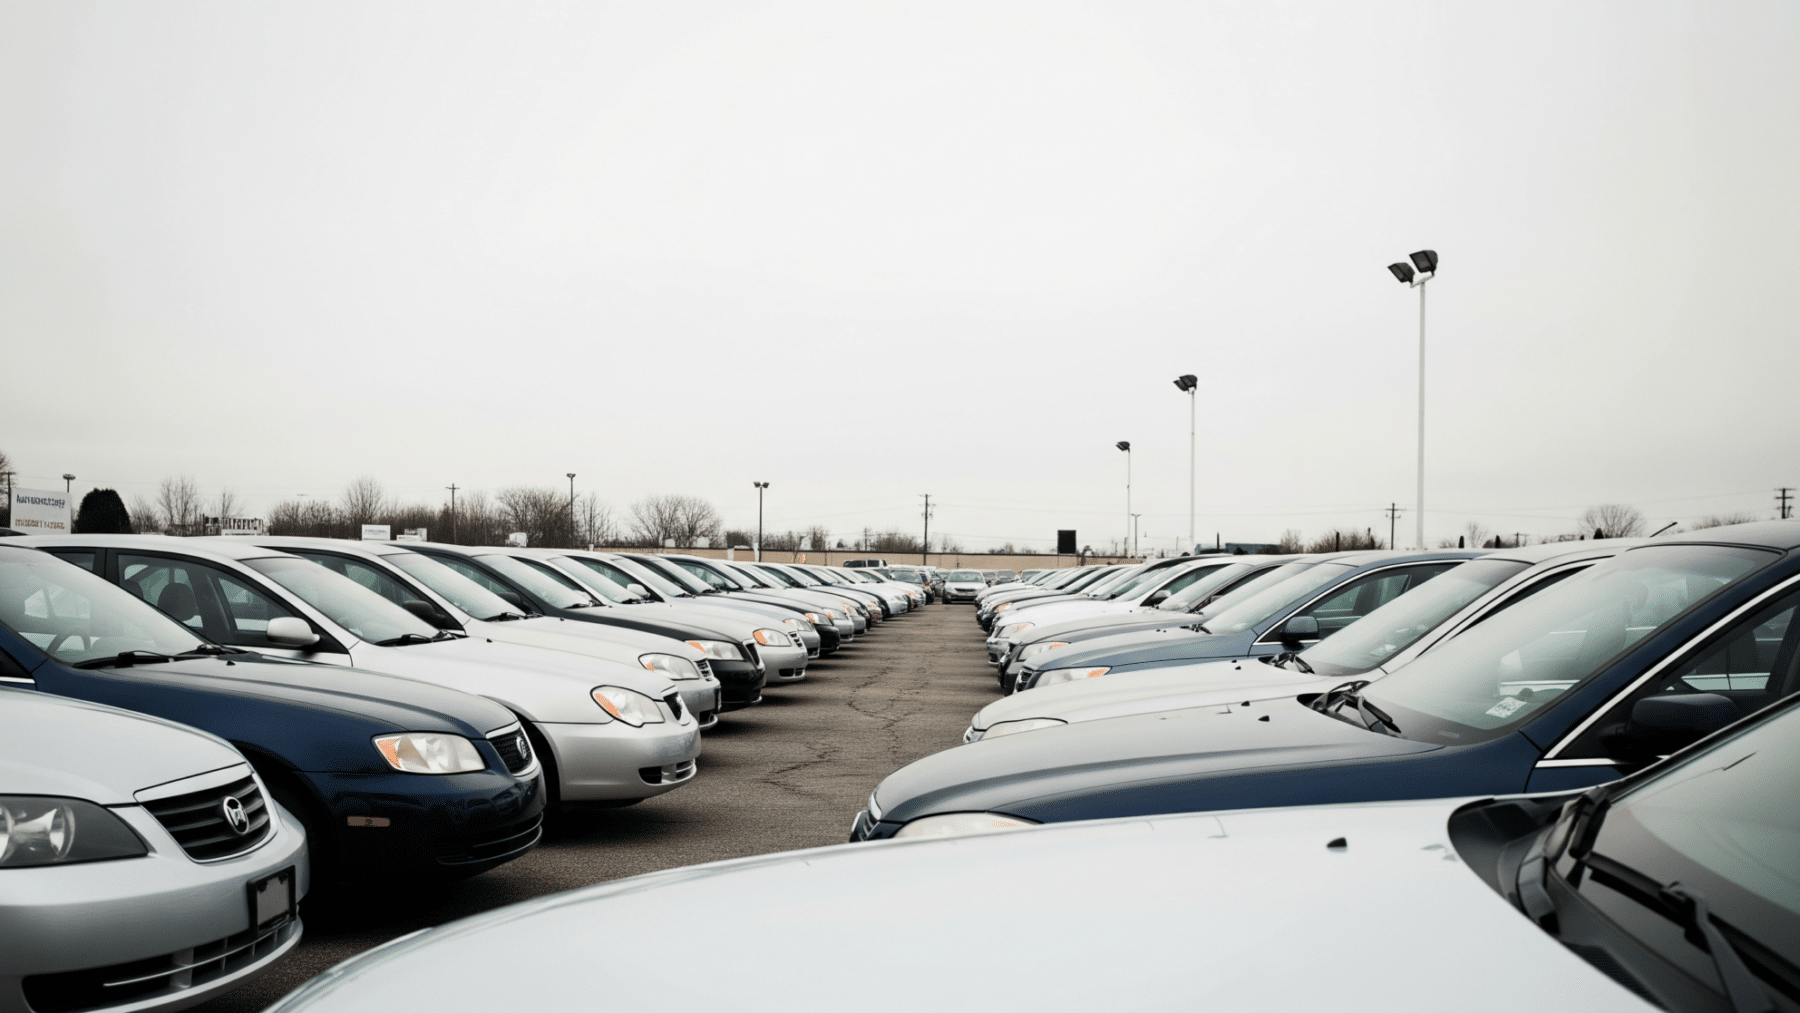
You find a used SUV listed online for $27,500. It looks like a fair deal. You have no idea that the real price negotiation happened weeks earlier, in a place you were never invited to.
Between the moment a car leaves its previous owner and the moment it appears on a dealer’s lot, it passes through a largely invisible market. That market sets the floor for almost everything you will pay.
Understanding how it works changes the way you shop.
The used-car price you see is already weeks old by the time you find it
If you have ever shopped for a used car at a dealership, you have likely heard the term “wholesale value.” A vehicle’s wholesale price is the amount the dealer paid to buy the car at an auction.
That auction price is not public. It is not on any window sticker. But it is the real starting point of every negotiation you think you are winning.
Wholesale price changes tend to become retail price changes after six to eight weeks.
By the time a listing appears on your screen, the dealer’s cost was locked in nearly two months earlier. That gap is the mechanism most shoppers never see.
A single index tracks what dealers are paying, and right now it shows where spring money went
The Manheim Used Vehicle Value Index is a trusted benchmark for tracking wholesale used-vehicle prices in the U.S., which helps dealers and analysts gauge market shifts and anticipate retail trends.
Millions of vehicles are sold at auction each year, with everything from rolling disasters to pristine luxury models, and large auction players like Manheim collect data on those sales, which helps set the market wholesale value for a vehicle.
Wholesale used-vehicle prices were higher in June, with the Manheim Used Vehicle Value Index climbing 2.1% year over year to 212.9, as normal seasonal patterns return to the market.
Retail used-vehicle prices remained elevated during the first half of 2026 as healthy demand, limited inventory, and higher wholesale prices in the spring placed upward pressure on retail pricing.
That 212.9 reading is not an abstract number. Dealers paid more for vehicles at auction through the spring, and that increase shows up on the window sticker for consumers all summer long.
Why inventory is tighter than it looks and older cars are suddenly winning bids
Stronger retail demand continues to be supported by new-vehicle affordability pressures that are pushing consumers toward used vehicles, while lower new-vehicle sales are constraining trade-in volumes and limiting supply into the used market.
When fewer new cars are sold, fewer trade-ins flow back through auction lanes. Less supply, same demand: prices firm up fast.
Under the surface, analysts have observed stronger pricing trends in older, more affordable units as strapped consumers look to offset higher prices in the rest of the economy by shopping for cheaper used vehicles.
The cheapest end of the lot is now the hottest end. That is a shift dealers have been watching all year.
As GCN reported, used-car gains stalled briefly in July, but the wholesale pipeline feeding retail lots was already building pressure again behind the scenes.
The six-to-eight-week lag is the hidden system that sets what you pay
Here is the mechanism in plain terms. A five-year-old SUV with 60,000 miles sells at auction for an average price of $12,000, which becomes the market wholesale price for that vehicle.
Dealers then tack on a few thousand dollars to cover their costs and generate a profit, which becomes the retail price.
Those dealer costs include transport, reconditioning, and lot fees. By the time the car is cleaned, photographed, and listed, six to eight weeks have passed since the bid closed.
According to Cox Automotive’s Q2 2026 report, the Manheim Used Vehicle Value Index reached 215.3 in March, an increase of 6.2% year over year and the highest point since the summer of 2023, with values higher by 2.3% compared to the start of the year. That spring surge is now fully baked into summer sticker prices shoppers are comparing against new-car window labels.
Off-lease EV maturities are increasing, driving EV weighting in the Manheim index to a record 3.9% in March, a level never seen before.
Off-lease EVs are returning in growing numbers, and a wider variety of returning lease vehicles is helping provide dealers and retail shoppers more options than they had just a few years ago.
What the second half of 2026 looks like for anyone buying used
Wholesale pricing is expected to follow a normal seasonal pattern for the remainder of the year, with the Manheim Used Vehicle Value Index forecast to rise approximately 2% by year-end 2026, consistent with long-term averages.
That is not a spike. It is a slow, steady climb that compounds across the lag and lands on every retail lot in the fall.
Inventory growth has been outpacing the pickup in sales as off-lease supply continues to increase, a trend that will continue through the second half of the year.
More supply arriving means competition at auction could soften dealer costs on some segments.
The practical takeaway is straightforward. Non-adjusted wholesale prices rose 2.7% in January 2026 against December 2025, well above the long-term January average of 0.4%, as tax-refund season ignited early demand. Shoppers who move before the next seasonal demand wave locks in a new wholesale floor tend to pay less.
The sticker you see today reflects a bid placed weeks ago. The one you see in January already has a higher bid behind it.
