Something flipped on a tracker that sits inside one of America’s most closely watched automotive data firms on a Thursday in late June, and nobody sent out a press release.
The number had been creeping toward a wall for months, and then it broke through.
For ordinary car shoppers, the timing could not be worse, and the mechanism behind it is one most buyers never think to look at closely.
A record that held for three years snapped in a single day
Data from the Automotive News/Catalyst IQ Vehicle Price and Inventory Tracker showed the average new vehicle marketed price hit $51,820 on June 26. On that date, pricing topped the previous record of $51,819, set on July 7, 2023, by one dollar, then crept up an additional $154 over the next four days.
That increase of $154 over four days meant the average marketed price of a new vehicle ended both June and the first half of the year at $51,974, which is $2,421, or 4.9 percent higher than the same day a year ago, as well as $314 higher than the end of May.
It is a milestone that crept up gradually, because the forces pushing it higher were hiding in plain sight.
How $30 billion in tariff costs started moving through every showroom in America
In the year since the Trump administration’s tariffs were imposed, the automotive industry incurred an estimated $30 billion in additional costs, according to data released by Kelley Blue Book parent Cox Automotive, with the average suggested retail price increasing 10.4 percent.
Imported vehicles saw the largest increases, rising an estimated $5,000 to $8,900 per vehicle.
Domestic vehicles also experienced cost increases of $1,600 to $2,000 per vehicle due to tariffs on materials such as steel and aluminum.
Despite higher list prices, consumers are paying 5.9 percent more on average over 37 weeks for model year 2025 and 2026 vehicles.
Dealers are absorbing the remaining 4.5 percent through negotiation and competitive pricing pressures.
But that dealer cushion has a limit, and shoppers who trade in a vehicle are running into another wall entirely.
The trade-in math that is making the record even more painful
According to Edmunds Q1 2026 data, 30.9 percent of trade-ins for new vehicles carried negative equity, the highest share of underwater trade-ins for any quarter on record since Q1 2021, with the average amount owed on those underwater trade-ins reaching $7,183, the highest ever for a first quarter and second-highest quarterly level on record.
The average monthly payment for all financed new-car buyers reached $772 in the fourth quarter of 2025, while buyers rolling negative equity into a new loan faced an average monthly payment of $916, a record high at that time.
As GCN has reported, incentive spending jumped 8.1 percent to $3,451 per vehicle as automakers competed for buyers even while prices climbed.
So if sticker prices are up, and incentives are rising too, what exactly is driving the record? The answer is something most shoppers scroll straight past.
The $2,795 line on the window sticker that nobody negotiates down
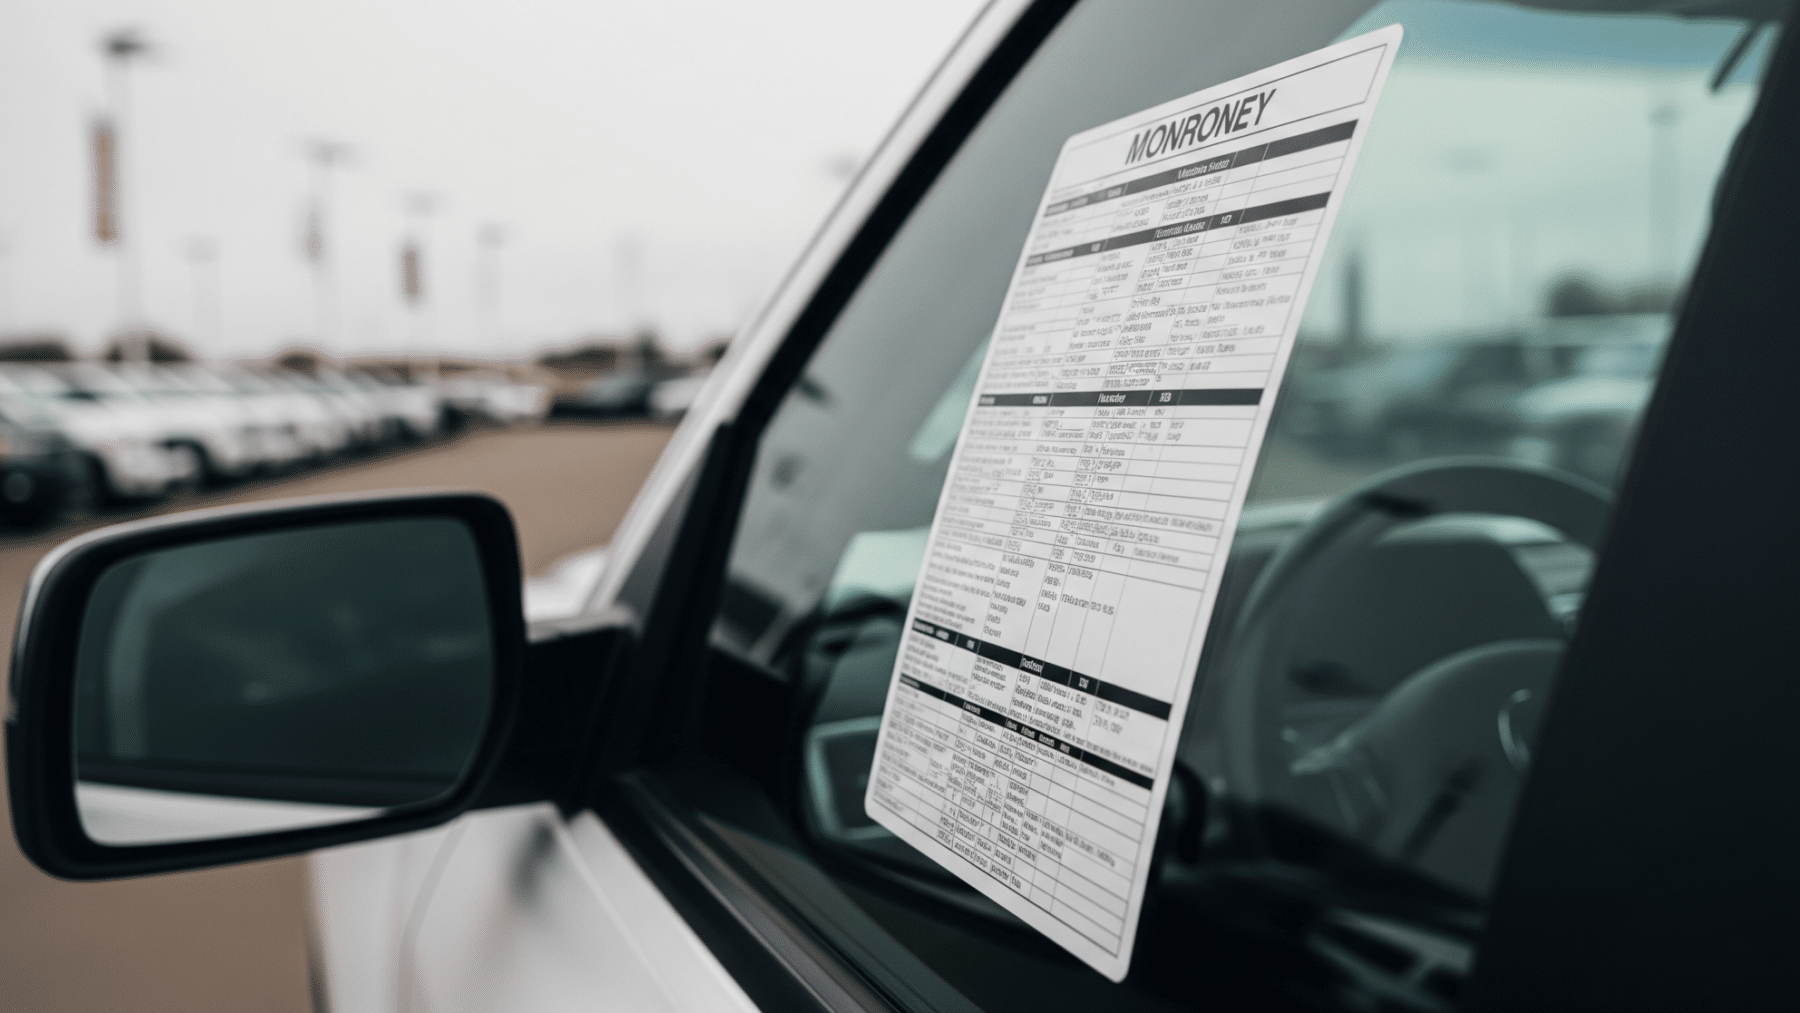
The real driver of this price record is the destination fee, the charge on every Monroney sticker that covers the cost of delivering a vehicle from factory to dealership.
According to Kelley Blue Book, since April 2025, GM increased destination fees three times, from $1,995 on the 2025 Chevy Silverado to $2,795, an $800 spike, or 40 percent increase, in less than a year.
The $2,795 charge applies to full-size and heavy-duty pickups, as well as full-size SUVs, across Ford and GM, including Lincoln in addition to the main Ford brand, and both Chevrolet and GMC at GM.
These fees are the charges automakers impose to cover the cost of shipping a vehicle from the factory to the dealership. They are not optional, and they are not negotiable.
They do not appear in the headline MSRP that gets advertised.
Destination charges have risen by up to 48 percent since 2021 as automakers have run out of ways to hide overall price increases, and the current tariff situation has accelerated that trend.
Industry analysts have pointed to automakers hiding some tariff costs inside the destination charge. That pressure is most visible in segments such as large pickup trucks and SUVs, where some destination charges now make up more than 7 percent of the vehicle’s price.
For buyers looking at the full picture of what tariffs do to a transaction, as GCN previously covered in its Ford Q2 2026 earnings breakdown, the pressure on the industry to pass costs downstream has never been stronger.
What buyers can actually do when every number on the sticker is going the wrong way
Domestic production increased 4.9 percent during the measured period, reaching 54.4 percent of all new vehicles sold, as automakers including Toyota and Stellantis announced multi-billion-dollar U.S. investments while Honda and Hyundai increase output at existing domestic facilities.
More American-made content should, over time, reduce the tariff exposure baked into each vehicle’s cost.
Buyers won’t see a line item for tariffs on the Monroney window sticker, but as costs continue to flow through the supply chain, consumers will find themselves paying more as the 2026 model year and beyond unfolds.
The destination fee is legally required to appear on every sticker, which means a sharp-eyed buyer who compares that line across brands and trims before sitting down to negotiate is starting the conversation with information most shoppers never have.
The record at $51,974 may not hold long. But understanding exactly which line pushed it there is a better tool than any coupon.
