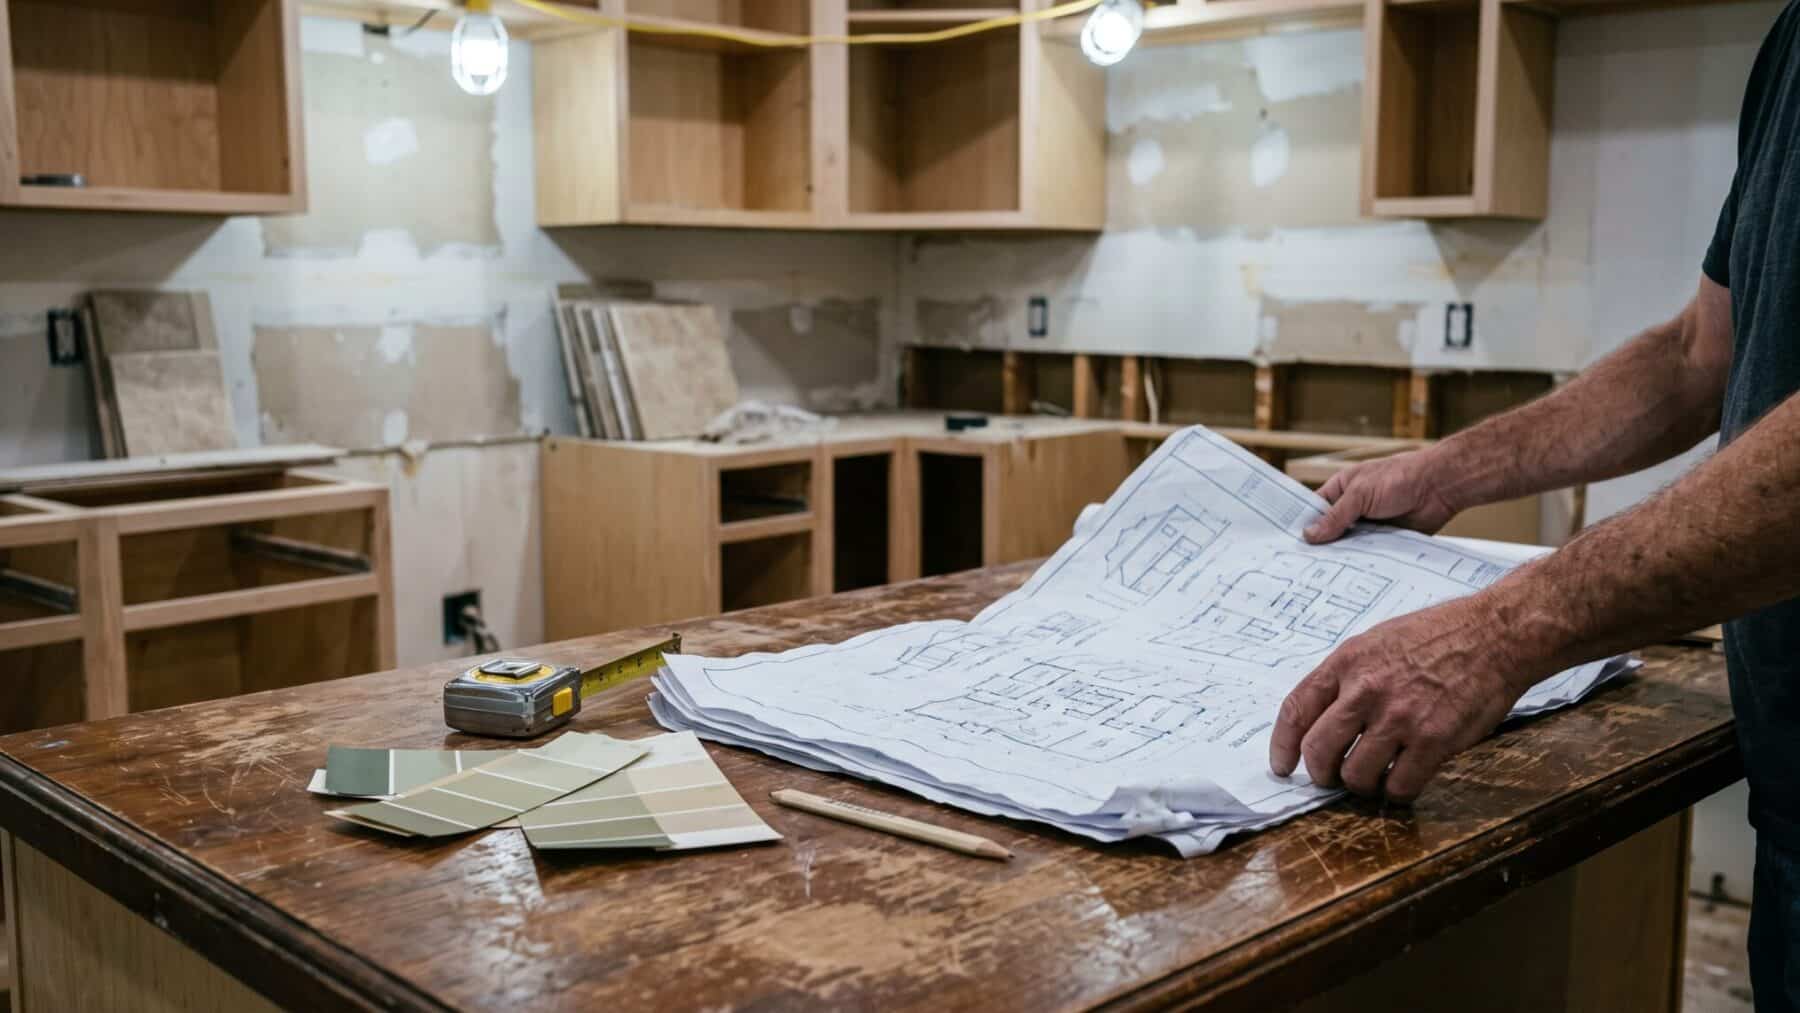
American homeowners are pulling back on renovation budgets in 2026 even as most remain committed to upgrading their homes, with the median planned spend falling by $5,000 in a single year, according to the largest annual survey of US residential remodeling activity.
Planned budgets drop sharply
The median planned renovation spend stands at $15,000 in 2026, compared with $20,000 in 2025 , a 25% decrease from 2025 , according to the 2026 U.S. Houzz & Home Study. The study draws on a survey of 20,358 users, including 10,176 renovating U.S. homeowners.
Half of homeowners (50%) plan to undertake renovation projects in 2026, down slightly from 52% in 2025. Plans across other project types have softened, with decorating at 41% and repairing at 35%, both declining from 44% and 37% in 2025, respectively.
Marine Sargsyan, head of economic research at Houzz, said “Home renovation continues at historic levels even as homeowners take a more cautious approach to future projects.” She added that what drives the resilience is “pent-up demand from homeowners who are finally able to act on long-planned renovations.”
What homeowners actually spent last year
The retreat in planned budgets contrasts with what homeowners actually spent in 2025. The median renovation spend held at $20,000 year over year, following a peak of $24,000 in 2023.
Higher-end spending increased, with the 90th percentile rising to $150,000 in 2025, up 7% from $140,000 in 2024.
Kitchens remained the most popular room to renovate at 26% of respondents, with guest bathrooms at 25% and primary bathrooms at 23%. Median kitchen renovation spend in 2025 increased 9.1% from 2024 to $24,000, while guest bathroom median totals rose 16.7% to $7,000 and primary bathroom spend grew 15.4% to $15,000.
Large and small furniture purchases were made by 39% of respondents, and 33% bought storage or organizational products. That figure reflects a broader drive toward functionality.
Renovators are focusing on functionality over looks for their kitchen upgrades, meaning more built-in cabinet storage for specific needs, new sinks or countertops, and expanded kitchen areas with new features like beverage stations or walk-in pantries.
Gen Z steps onto the renovation ladder
Gen Z homeowners now account for 0.5% of all renovators, up from 0.2% the year prior, and they are significantly more likely to renovate following a recent home purchase (61%) compared with Millennials (31%).
The pattern suggests younger buyers are treating a newly purchased home as an immediate project rather than waiting years to take on improvements. That generational contrast is likely shaped by the cost and scarcity of move-in-ready inventory.
Baby Boomers remained the largest share of renovating homeowners in 2025 at 54%, a five-percentage-point decrease from 2024, while Gen X was up five points to 34%. Seniors spent the most on renovations, with a median spend of $25,000, slightly above Gen X at $24,000.
Among households earning $150,000, $200,000, 64% described themselves as very confident about moving ahead with renovations heading into 2026. By contrast, among households earning between $50,000 and $100,000, only 32% reported being very confident.
Financing the work that does get done
According to the Houzz survey, while the majority of homeowners (84%) continue to rely on savings to fund renovations, more than a third (34%) use credit cards, with the percentage up by 5 points year over year. That share underlines the degree to which many households are pressing ahead despite tighter budgets rather than deferring projects indefinitely.
Time and financial readiness continue to be the leading renovation triggers. The share reporting finally having the time to renovate is unchanged year over year at 40%, while the share citing financial readiness edged up to 36% from 35%.
The spending plateau in 2025 followed by a lower planned budget for 2026 echoes a pattern seen elsewhere in consumer behavior. The majority of homeowners expect some challenges during their projects, with rising product and material costs topping the list at 63%, followed by higher labor costs at 31% and finding available professionals at 25%. Households that feel stretched are still investing in their homes, often because they cannot move, but they are trimming scope, leaning on credit, and looking for ways to extract more value from existing space rather than adding it.
