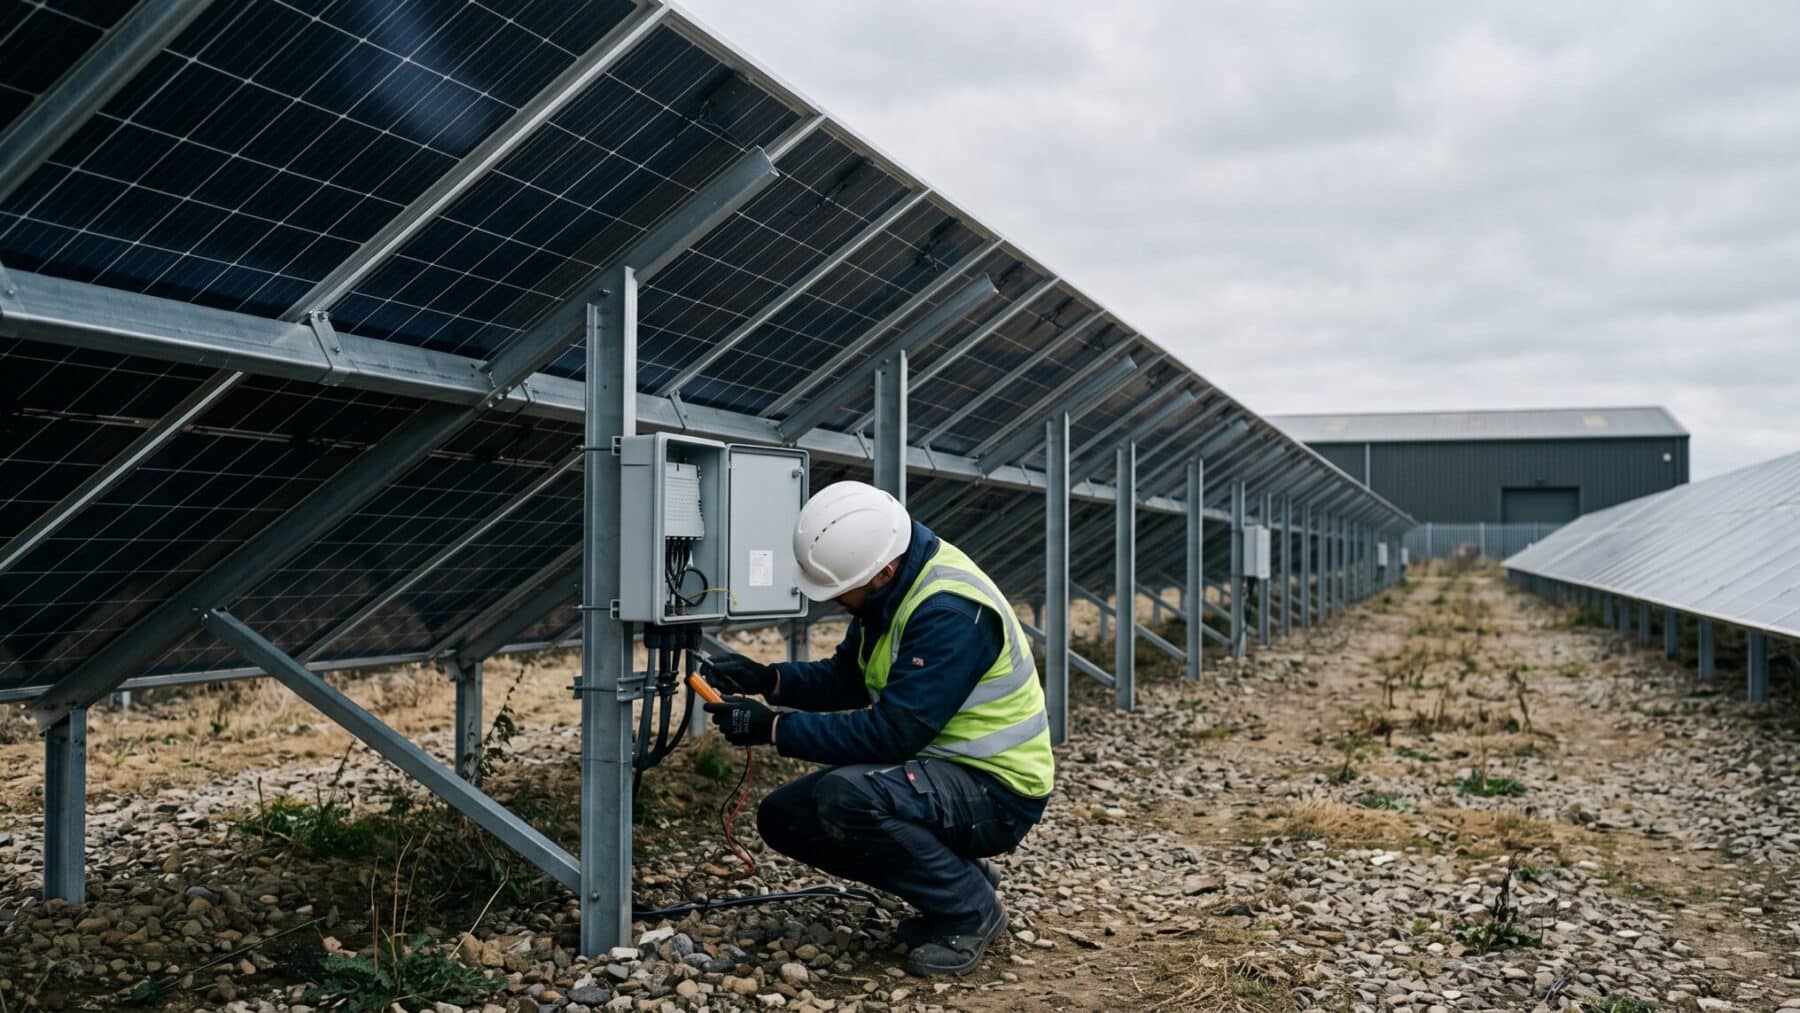
The United States added 7.8 gigawatts of new solar capacity in the first quarter of 2026, surpassing 6 million cumulative installations, yet that headline figure masks a deepening tension at the heart of the industry.
The solar industry installed 7.8 GWdc of capacity in Q1 2026, a 27% decline from Q1 2025 and a 42% decline compared with Q4 2025.
Contracts surge while builds slow
The Solar Market Insight 2026 Q2 Report released by the Solar Energy Industries Association (SEIA) and Wood Mackenzie finds that contracts for utility-scale solar rose 15% year over year, fueled by tech companies securing power to meet growing AI-driven electricity demand. The report’s industry-wide forecast was revised upward as electricity demand continues to surge.
Despite ongoing policy changes and regulatory actions that have created headwinds for clean energy development, solar power combined with energy storage continued to dominate new capacity additions, accounting for about 91% of all new power capacity installed in Q1 2026. Solar by itself accounted for 60% of all new capacity.
The utility-scale segment installed 5.9 GWdc, declining 34% year-over-year and 45% quarter-over-quarter. These first-quarter installations reflect typical seasonality for the solar industry, but the steepness of the year-over-year drop points to broader headwinds including federal permitting uncertainty that SEIA flagged throughout the report.
Residential market faces a difficult year
The residential solar market is expected to decline by 21% in 2026, but forecasts show the sector will see consistent growth between 2027 and 2031. In Q1, a record 45% of residential solar installations were paired with battery energy storage.
In the residential sector, volumes were buoyed by an overflow of installations that had been initiated at the end of 2025 so customer-owned projects could qualify for the expiring Section 25D tax credit. That pull-forward effect is now exhausted, leaving the residential segment to find a new demand floor without a near-term federal incentive backstop.
SEIA and Wood Mackenzie report a total utility-scale pipeline of 216, 240 GWdc that supports strong utility-scale buildout through 2030, even when accounting for attrition. That buffer gives project developers a runway to work through permitting delays against the most severe demand scenarios.
The solar manufacturing cell gap
No additional solar module manufacturing capacity was added in Q1 2026. Module manufacturing has grown tremendously in the last few years, and several new cell and wafer facilities are in development.
America’s solar module factories have expanded, with nameplate US module capacity surpassing 70 GW, well above the country’s 2025 annual installation total. But the industry’s latest data reveal a critical gap one step upstream: the United States has limited domestic solar cell manufacturing capacity, with most module assembly lines remaining dependent on imported cells and wafers to keep production running.
As GCN has reported, Trump’s Section 232 polysilicon action signed on August 6, 2026, imposes new tariffs on imports of polysilicon and certain downstream polysilicon derivatives. The proclamation imposes a 15% ad valorem tariff on imports of downstream products including polysilicon ingots, wafers, solar cells, and solar modules, effective December 4, 2026, designed in part to make domestic cell production more commercially viable. Qcells has begun manufacturing solar cells at its Cartersville, Georgia factory, marking a major milestone toward completing the country’s only vertically integrated solar manufacturing plant. By Q3 2026, Cartersville is expected to produce 3.3 GW each of ingots, wafers, and cells, and 3.5 GW of modules a year, which would make the site the largest operating solar cell factory in U.S. history.
The Solar Energy Industries Association organized the American Solar and Storage Manufacturing Expo on Capitol Hill, which brought manufacturers together to highlight domestic manufacturing investments since 2022. Wood Mackenzie data show nameplate US module capacity has surpassed 70 GW, a significant jump from just 8 GW before federal manufacturing tax credits took effect.
What the next five years look like
Bringing plants online requires working through severe execution barriers, including long land acquisition timelines, slow local environmental permitting, and extended waits for utility transformer grid connections. Those barriers are especially acute for capital-intensive upstream steps such as cell and wafer production, where the technology demands are higher and the domestic supply chain is thinner.
Contracts for utility-scale solar rose 15% year over year, fueled by tech companies securing power to meet growing AI-driven electricity demand. The report’s industry-wide forecast was revised upward as electricity demand continues to surge. That corporate appetite provides a durable floor for the pipeline even as near-term install numbers soften.
The challenge the industry now faces is converting a record book of signed contracts into completed plants fast enough to match the demand those contracts represent, a task that depends heavily on closing the gap between what America’s solar manufacturing sector can finish at home and what it still must source abroad.
