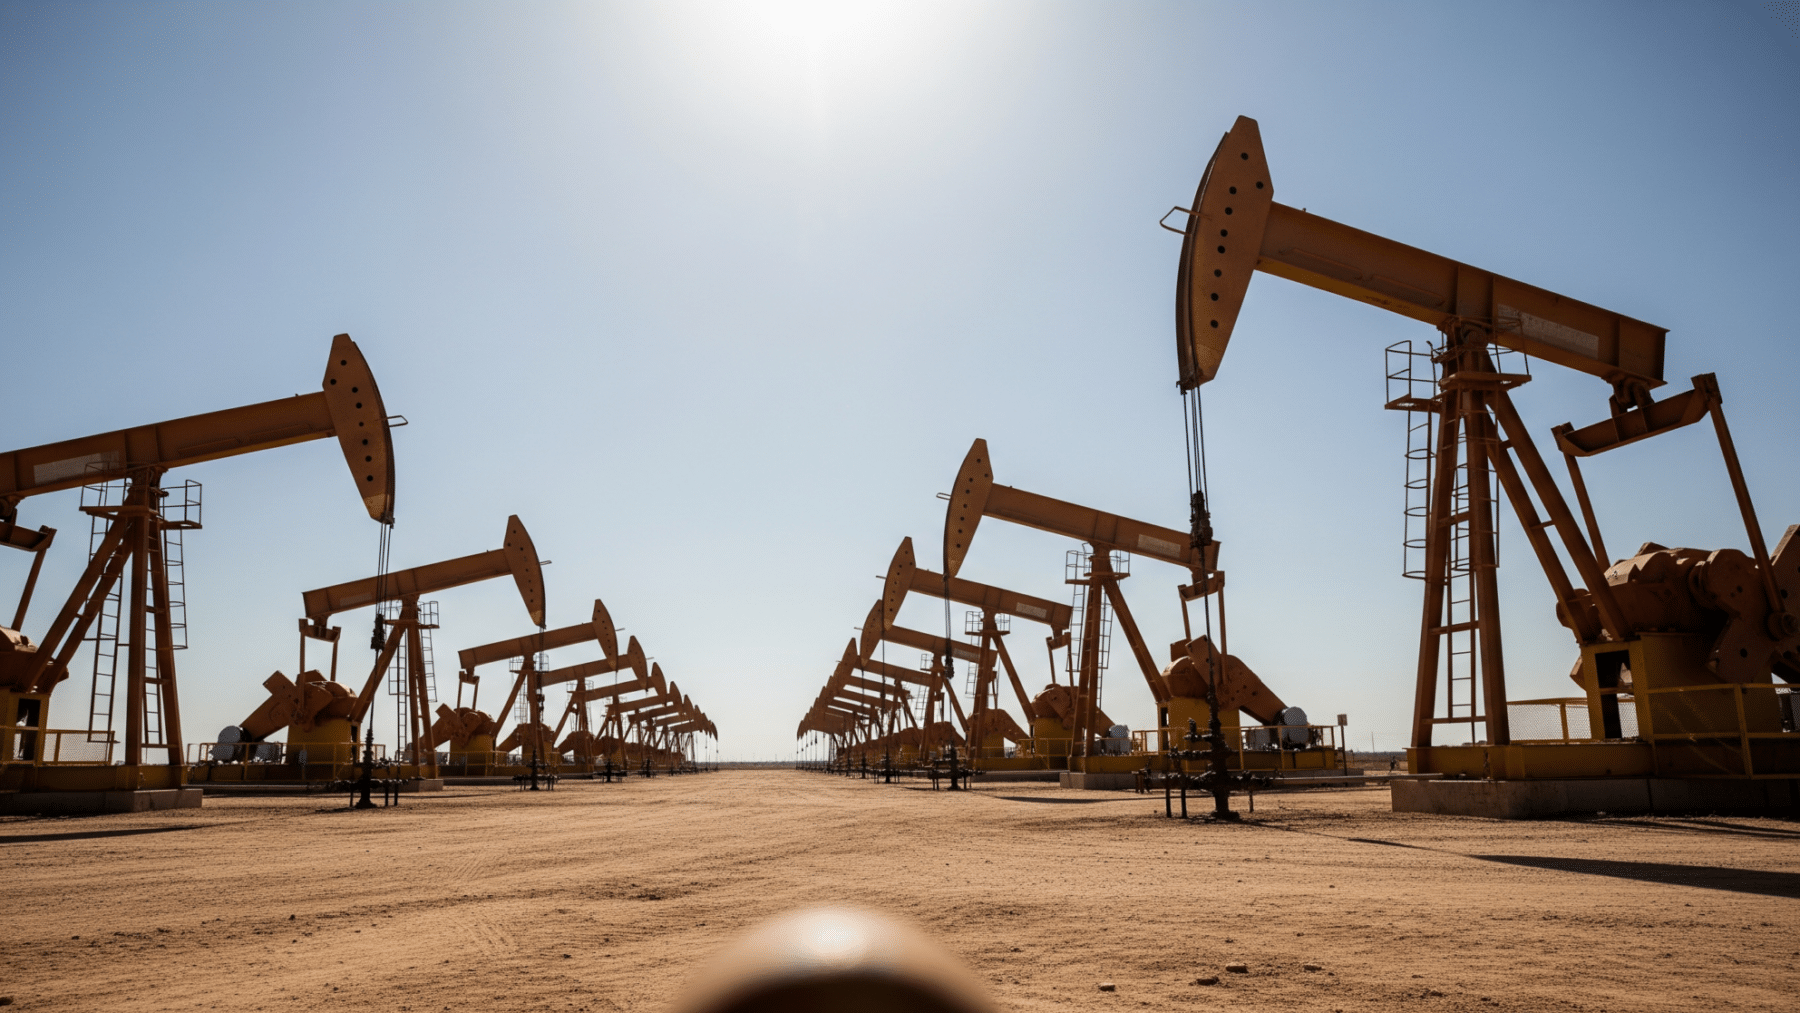
The United States set a new global record for crude oil output in 2025, extending its position at the top of the world rankings for the eighth straight year.
Crude oil production in the United States, including lease condensate, averaged a record-high 13.6 million barrels per day (b/d) in 2025, breaking the previous U.S. and global production record of 13.2 million b/d set in 2024.
A streak stretching back to 2018
The United States remained the world’s largest crude oil producer in 2025, according to the EIA’s International Energy Statistics database, extending a streak that began in 2018 when the United States overtook Russia to become the world’s leading producer.
U.S. crude oil production was about 40% higher on average in 2025 than that from the next two largest global crude oil producers, Russia and Saudi Arabia.
Russia’s crude oil production averaged 9.9 million b/d in 2024 and remained largely unchanged in 2025, as a combination of voluntary production cuts and the effects of the conflict with Ukraine limited crude oil output growth. Crude oil production including lease condensate in Saudi Arabia increased from 9.2 million b/d in 2024 to 9.6 million b/d in 2025, reflecting modest growth as a result of OPEC+ unwinding voluntary production cuts.
The U.S. accounted for more than a 16% share of global crude oil production in 2025. The country surpassed Russia in 2018 and in 2023 became the largest producer of crude oil of any country in history, with production that year averaging 12.9 million b/d.
Permian Basin drives the gains
Production growth was particularly strong in the Permian region of western Texas and southeastern New Mexico, which accounted for 48% of total U.S. crude oil production and where output grew by 280,000 b/d to 6.6 million b/d in 2025.
Production from the Lower 48 states excluding the Gulf of America accounted for 11.3 million b/d, or 83% of total U.S. crude oil production in 2025, with the remainder coming from the Federal Gulf of America and Alaska. That robust onshore output has also lifted U.S. petroleum exports to successive records in recent months.
The EIA attributed the sustained output gains to continued gains in drilling productivity and operational efficiency across key shale basins, which allow operators to extract more oil per well.
In 2025, the number of active rigs per month in the Lower 48 states was 5% less than in 2024 and 1% fewer wells were drilled. Despite less rig activity and fewer wells, efficiency improvements continued through 2025 and resulted in a net increase in crude oil production.
Output grew despite falling prices
The output growth unfolded despite lower oil prices: West Texas Intermediate dropped from an average of $77 per barrel in 2024 to $65 per barrel in 2025 amid global oversupply. Producers were able to sustain momentum because shale technology kept per-well yields rising even as the number of active rigs declined.
Alongside rising crude oil production, U.S. associated natural gas production has also surged, driven by activity in oil-dominant plays like the Permian. This abundance of associated gas has continued to support domestic natural gas-fired electricity generation and growing natural gas exports.
Those dynamics have contributed to the tracking of domestic crude storage, with analysts monitoring Cushing inventory levels closely as a barometer of supply-demand balance.
EIA projects further growth through 2027
According to the EIA’s July 2026 Short-Term Energy Outlook, U.S. crude oil production is forecast to average approximately 13.8 million b/d in 2026, before reaching approximately 14.0 million b/d in 2027.
Total energy production in the United States increased to a new record of 107 quadrillion British thermal units in 2025, a 3.4% increase from the previous record set in 2024, according to the EIA’s Monthly Energy Review. That growth was driven by record-high production in natural gas, crude oil, natural gas plant liquids, and renewables.
It marked the fourth consecutive year in which the United States set a record for total energy production.
The EIA’s full annual figures are drawn from its International Energy Statistics database, which publishes comparable production data across all major producing nations and serves as the authoritative benchmark for year-over-year global comparisons.
