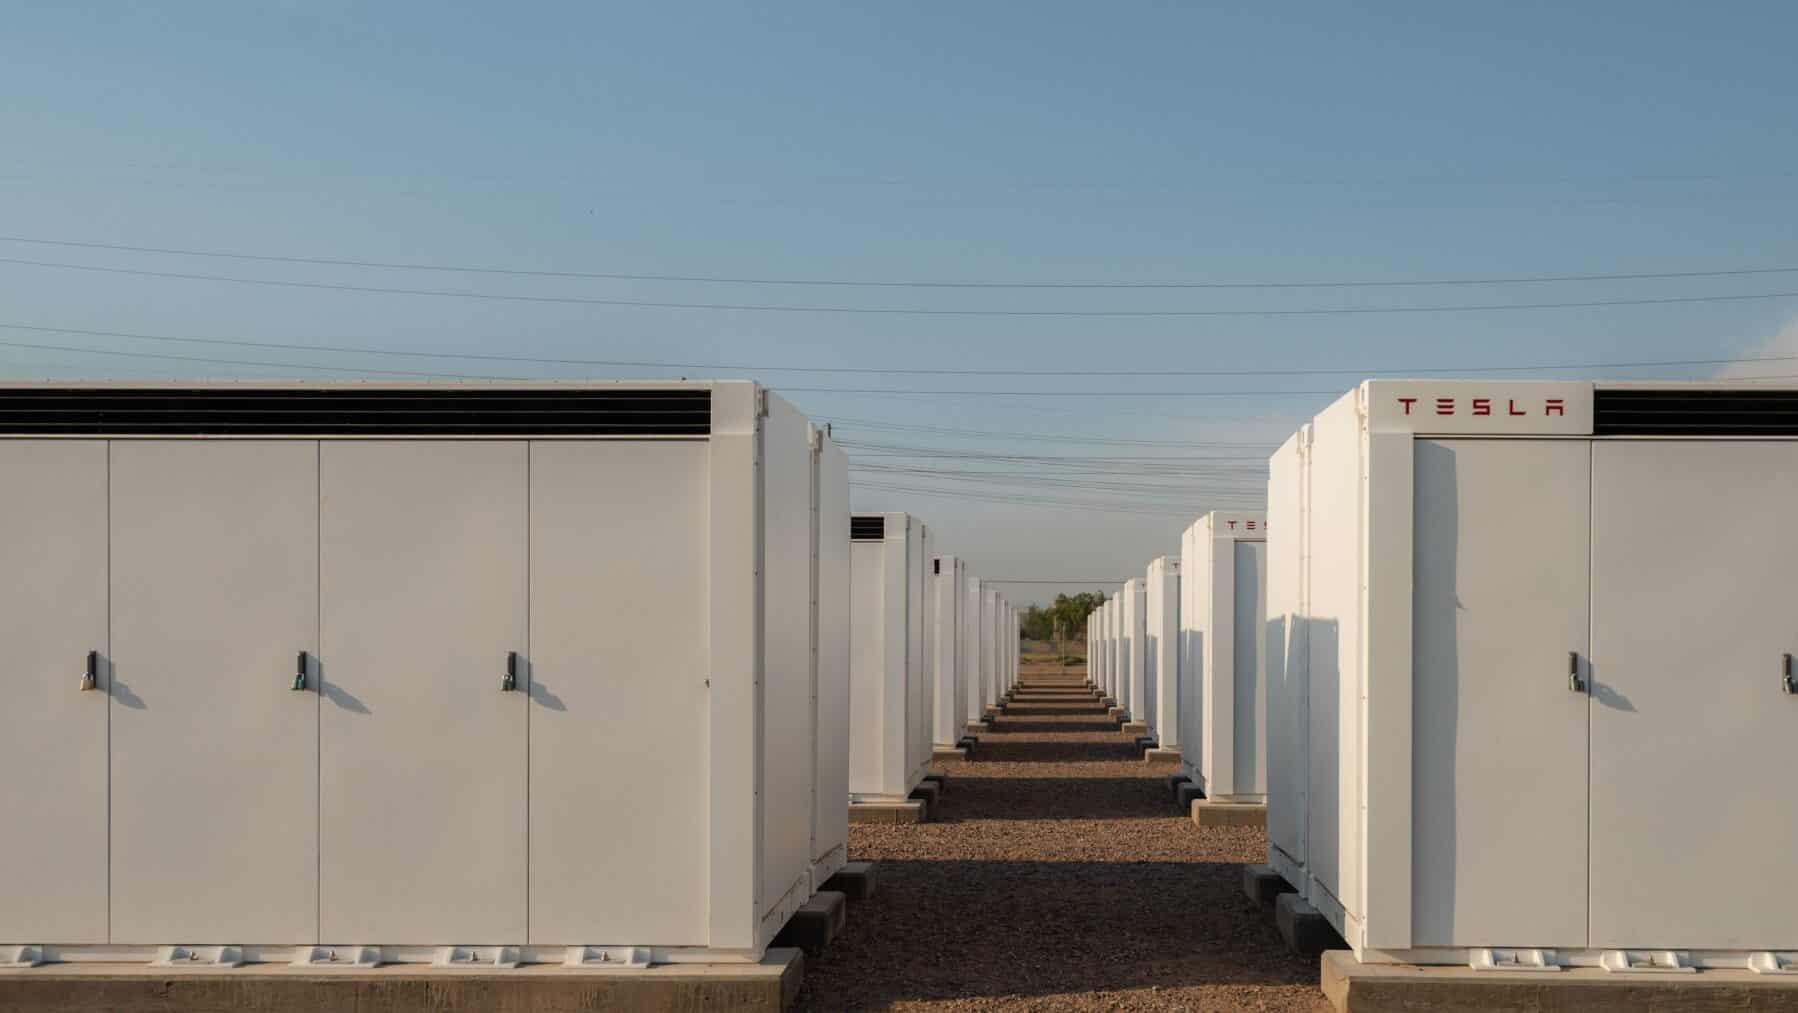
Rows of white steel containers stretch across an Arizona desert floor, each one packed with lithium iron phosphate cells.
Nothing moves except a few hard-hatted workers walking the perimeter.
No fuel burns here, no turbine spins.
But when the sun sets and air conditioners keep running, these boxes push electricity back onto the grid faster than a gas peaker plant can respond.
One state. One quarter. A record that caught analysts off guard.
So what made the machines run faster than the forecasts?
How a battery storage facility charges the grid in minutes, not hours
A utility-scale battery storage site works on a straightforward physical principle: charge when power is cheap, discharge when it is expensive or scarce. Lithium iron phosphate cells, the chemistry now dominant in grid storage, accept and release electrons through a reversible electrochemical reaction that takes milliseconds to answer a grid signal.
That response time is the core commercial advantage over a gas peaker plant, which needs ten minutes or more to warm up. At the scale now deployed across Arizona, Texas and California, these facilities wire directly into the high-voltage transmission system through large inverters that convert direct current from cells into the alternating current the grid carries.
Because batteries can absorb power as well as release it, they also act as a shock absorber when solar generation briefly overwhelms local demand mid-day. That two-way capability is why grid operators increasingly treat storage as core infrastructure, not a backup option.
Arizona, Texas and California rewrote the map of where storage gets built
The desert Southwest and Sun Belt have displaced the old California-and-Texas duopoly as the most active construction zones for large grid batteries. Arizona alone installed 6.2 GWh of utility-scale capacity in Q2, the largest quarterly deployment for any state in history, driven largely by four of the quarter’s seven gigawatt-scale projects.
Texas added 3.8 GWh and California 3.6 GWh during the same quarter, while Utah also exceeded 2.5 GWh, confirming the build-out has spread well beyond the two states that once accounted for almost everything. Ten states each added more than 500 MWh in the first half of the year.
Forty-four percent of new utility-scale capacity added in Q2 was co-located with solar generation, pairing panels and batteries on the same grid connection so a single project can sell power around the clock. That pairing is pushing storage into states with strong sunshine but limited existing grid infrastructure. For context on how interconnection rules shape where projects land, a federal order now requires all six US grid operators to justify or reform their large-load rules, a reform that could accelerate the queue.
The numbers behind the record, and where they come from
The 20.2 GWh figure comes from the US Energy Storage Market Outlook Q3 2026, published by the Solar Energy Industries Association and Benchmark Mineral Intelligence on September 1, 2026. That represents a 108 percent increase from the previous three-month period.
The record quarter brought total installations for the first half of 2026 to 30.8 GWh, up 23 percent year over year. More than 10 percent of all US battery storage capacity now operating came online in Q2 alone. Benchmark Mineral Intelligence noted that the desert Southwest build cycle has spread strong pipeline growth into Arizona, Nevada, Oregon, Colorado and several other states that previously played little role in storage deployment.
Battery energy storage also supplied more electricity to the grid in the first eight months of 2026 than in all of 2025, a supply-side milestone separate from new capacity figures. Annual installations rose roughly 29 percent in 2025, so the pace has been compounding for several years.
Where the record does not hold, and what is still running behind
The residential segment moved in the opposite direction. Of the 20.2 GWh installed in Q2, only 657 MWh landed in homes, reflecting the expiration of a residential tax credit that had pulled demand forward into late 2025. Home battery installations surged in Q1 as homeowners raced to meet an eligibility deadline, then fell back sharply.
Manufacturing is also catching up. Two new battery cell manufacturing facilities opened in Ohio and Tennessee during the quarter, and the report noted that planned North American manufacturing capacity continues to expand, but most is still under construction or in permitting, so the supply chain leans heavily on imported cells for now.
The cost of connecting new storage to the grid is a live issue too. Transmission upgrades for large battery projects run into hundreds of millions of dollars, and who pays is far from settled. Commercial charging depots face the same grid-cost uncertainty at a smaller scale, as shown by the diverging approaches three California utilities have taken to depot loads at 600 kilowatts, a preview of the billing complexity larger storage projects face at the substation level.
What the revised forecast means for power prices and grid reliability
SEIA and Benchmark raised their cumulative 2030 storage forecast to 683 gigawatt-hours, up roughly 11.5 percent on the back of this quarter’s numbers, and lifted their full-year 2026 installation forecast to 71 GWh, roughly 20 percent above the approximately 59 GWh installed in all of 2025.
Utility-scale storage capacity in the United States has nearly doubled, from 88 GWh to 165 GWh, in the first 18 months of the current build cycle. Data center expansion, industrial electrification and extreme weather have all pushed peak demand higher than most grid planners projected even two years ago.
More capacity does not automatically mean lower bills, but it does give the grid more tools to avoid the price spikes that occur when demand briefly outstrips supply. Each additional gigawatt-hour reduces the number of hours per year when a grid operator must call on the most expensive gas plants to cover a peak.
That arithmetic is drawing utilities, corporate buyers and independent developers into the same desert fields at the same time, and why the record set this summer is already likely to be broken before the year is out.
