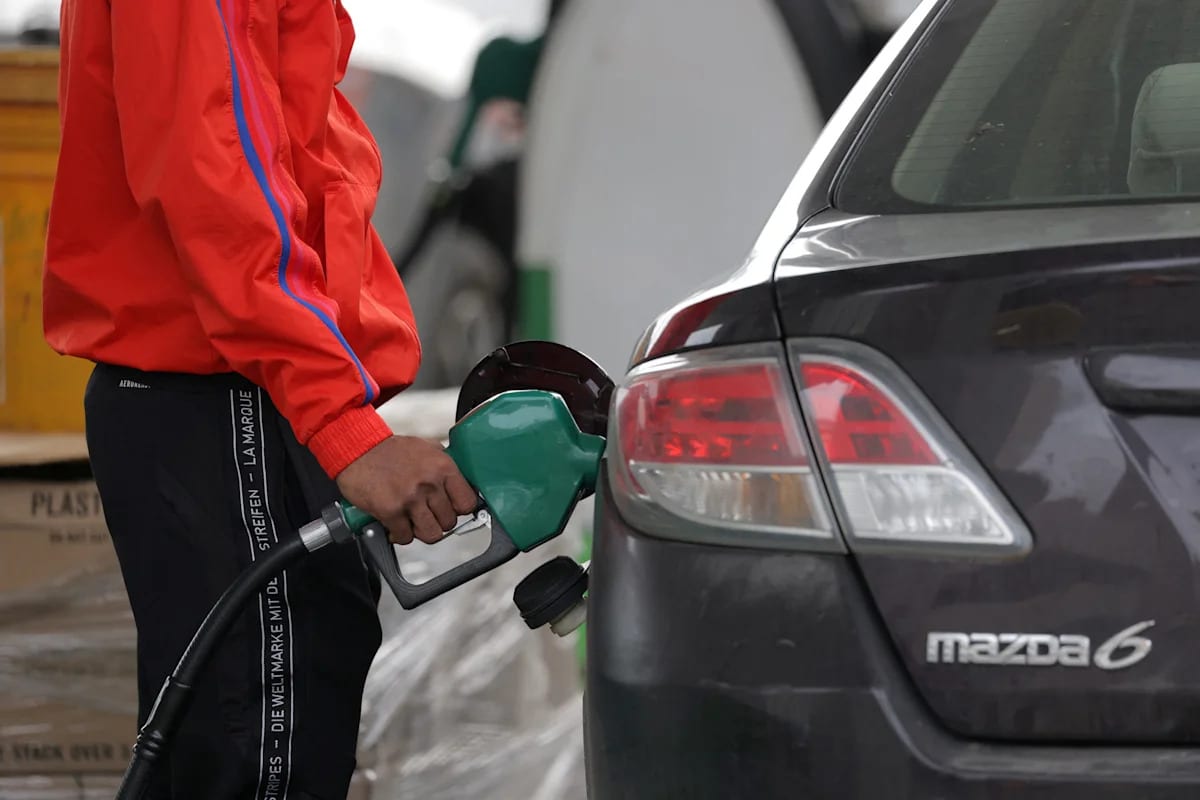
Nearly three-quarters of Americans, 74%, say they are very concerned about the price of gas and energy, but the generation old enough to remember the 2008 spike knows pain at the pump has been worse before, according to a new Pew Research Center analysis.
Since 1990, which is as far back as the EIA has data, June 2008 was the most expensive month to fill your tank once inflation is factored in. That month, the national average price for regular unleaded gas was $6.18 a gallon in today’s dollars, and diesel was $7.26 a gallon, also in 2026 dollars.
That means anyone under roughly 35 today has no adult memory of paying what their parents or older coworkers paid at that peak. Even so, 2026 prices feel record breaking to them.
Work time tells the real story
Pew measured the burden differently than a simple price tag, by calculating how many minutes of work it took to afford a gallon of fuel. Pew calculated that buying a gallon of regular conventional gasoline in October required about 9.5 minutes of work at the national median wage, compared with 6.3 minutes in February.
Back in July 2008, buying a gallon of gas took 16 minutes of work, the most ever in the period Pew studied.
Diesel told an even starker story. In October 2026, it took 14.4 minutes of work at the national median earnings rate to buy a gallon of diesel, up from 8.4 minutes in February of this year. That’s approaching the all-time high set in July 2008, when the typical person would have had to work 18.8 minutes to earn enough for a single gallon of diesel.
That work-time gap matters for how different age cohorts interpret the same headline. A worker who entered the labor force after 2010 has only ever known gas prices within a narrower band relative to a paycheck, with no personal memory of the 2008 peak.
That leaves less room for older Americans’ frame of reference to register with younger drivers hearing “record gas prices” for the first time in their adult lives.
Concern has climbed sharply since January
Whatever the historical comparison, worry is climbing fast across the board. The analysis comes as 74% of Americans say they are very concerned about gas and energy prices, up from 60% in July and 43% in January, according to a separate Pew survey.
The jump tracks the escalation of the U.S.-Iran conflict and the oil price swings that followed. Pew’s original analysis notes that concern about gas prices is up across the political spectrum, though it is higher among Democrats and Democratic-leaning independents (81% say they are very concerned) than among Republicans and Republican leaners (65%).
Geography adds another layer
Where a driver lives can matter as much as when they were born. The petroleum industry is concentrated along the Gulf Coast, so gas tends to be cheapest there. In October 2026, regular-grade conventional gas averaged $3.86 per gallon in the Gulf Coast region.
California, by contrast, almost always has the most expensive gas in the country. California’s regular-grade average was $6.06 per gallon in October 2026.
For a young adult who moved from the Gulf Coast to California, the generational gas price story becomes a geographic one overnight, with the sticker shock arriving regardless of what year it is.
Why the comparison matters now
Pew used Energy Information Administration prices, Bureau of Labor Statistics inflation measures and Current Population Survey earnings data accessed through IPUMS, with monthly 2026 inflation adjustments estimated using the main consumer price index because the retroactive series is updated annually. Because earnings data for September and October 2026 was not available when Pew accessed the dataset, August’s median hourly figure was used for those months instead.
That methodology lets economists and households alike separate sticker shock from the underlying economic burden, a distinction that tends to split sharply along generational lines since only those who filled a tank in 2008 have a personal benchmark for comparison.
The findings add gas prices to a growing list of everyday costs that different generations experience in starkly different ways even when the national average looks identical on paper.
