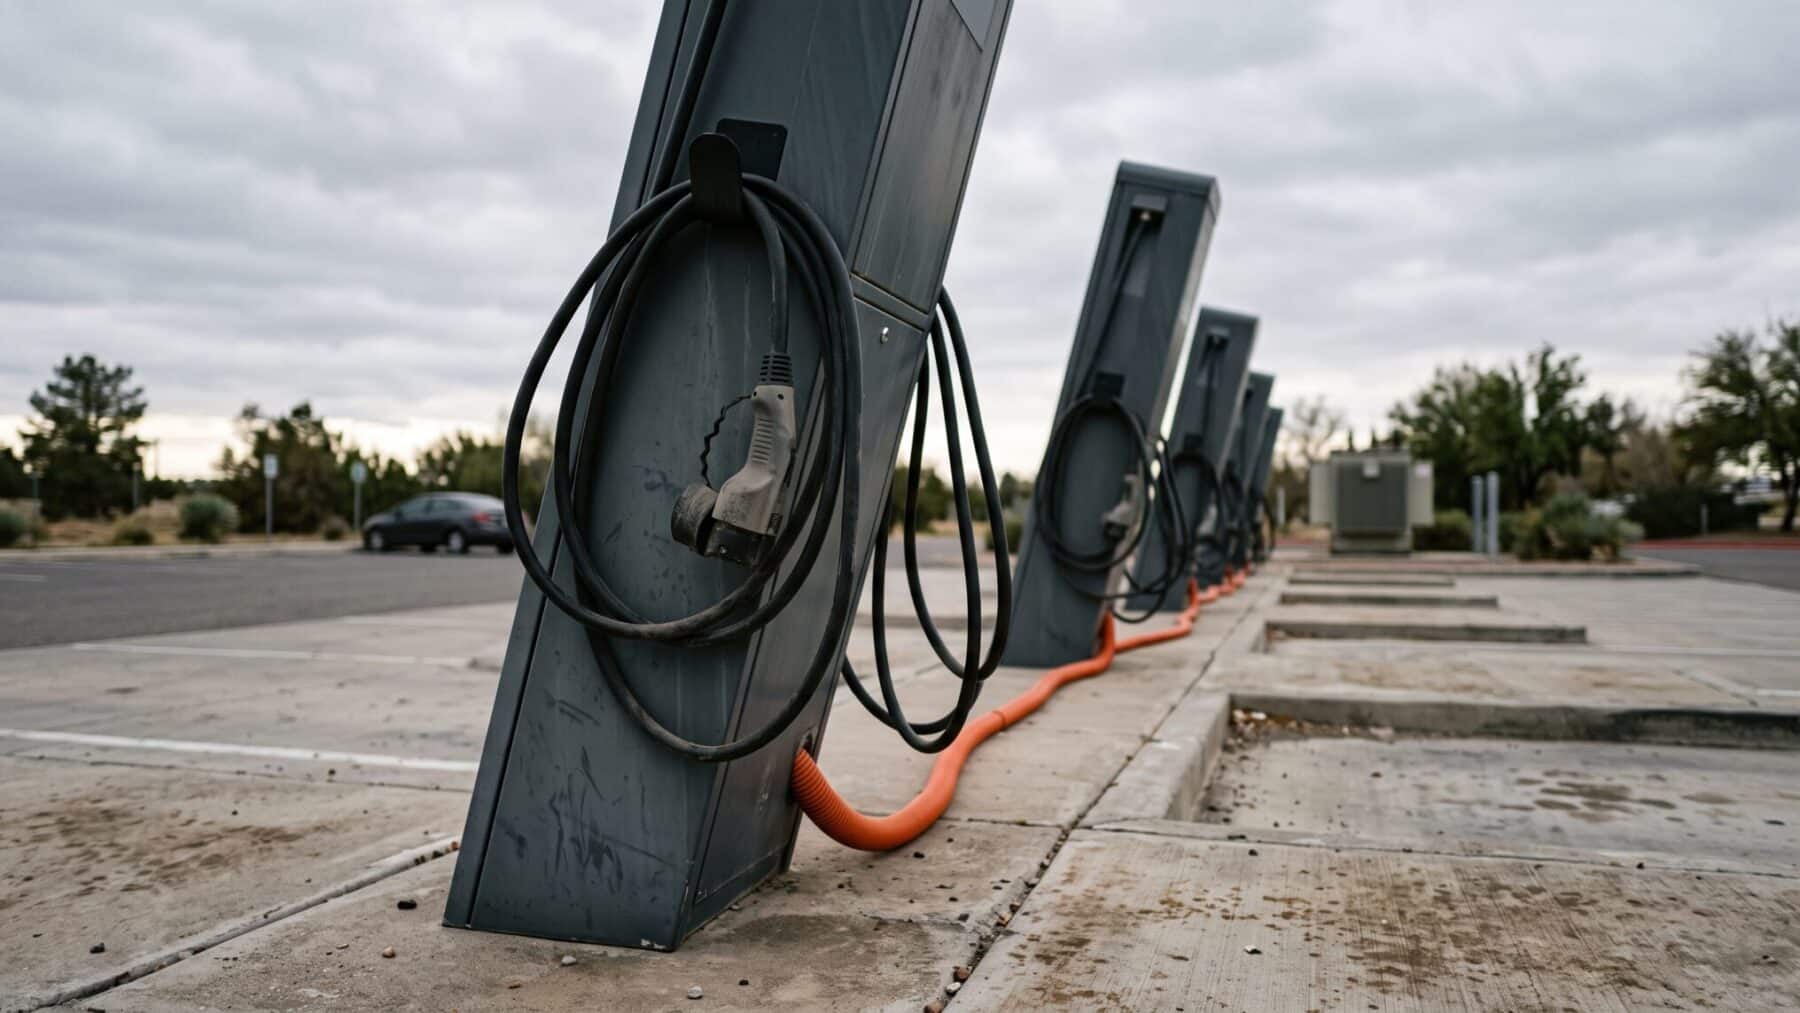
A driver pulls up to a bank of six fast chargers on a highway shoulder, and only two of the cables are in use.
That gap between hardware installed and hardware actually working has become the real story this fall.
Across the country, more stalls are going in every month than ever before.
Yet the share of time any single one of them is actually charging a car has barely moved in over a year.
Something in how these networks get built just shifted.
Why more chargers are not translating into busier chargers
The mechanism is simple once you see it: station footprints are growing faster than the number of drivers who need them on any given day in most places, even as total demand climbs nationally. Operators are adding ports in bigger clusters per site rather than spreading thin networks across new towns, which keeps construction crews efficient but spreads new driver demand across more plugs.
That matters because utilization, the share of time a port is actually dispensing electricity, moves slowly even when both sides of the market grow together. When a company adds four more stalls to an existing twelve-port station, it does not create four new drivers out of nowhere.
It just means more parking options for the same crowd of EV owners, so each individual charger can log fewer paid minutes even while total sessions rise.
So the pattern shows up nationally as flat utilization even as the network keeps growing and total charging sessions climb alongside it. Paren’s own Q3 2026 report describes this as deliberate build-ahead capacity, a close balance between supply and demand rather than one side racing ahead of the other.
Inside the fall numbers reshaping who builds what
The scene at these stations looks different depending on whose logo is on the canopy. Non-Tesla operators have been closing the site-size gap with the industry’s biggest network, even though Tesla still builds the largest stations on average by far.
According to the latest quarterly tracking, the fast charging network crossed 80,000 ports for the first time this summer, with operators adding over 4,000 new ports in the third quarter even as the pace of new station openings slowed from a year earlier. That is a market still expanding, just unevenly distributed.
Meanwhile Tesla’s new Supercharger sites averaged 13.1 ports this quarter, down from 14.9 a year ago, while new non-Tesla sites averaged 5.0 ports, up about 22 percent from 4.1 a year earlier. That is a narrowing, not a reversal.
Tesla still builds the biggest individual sites in the country, more than twice the size of the typical new non-Tesla station. Everyone else is catching up with larger station footprints of their own, even if they remain well behind Tesla’s average.
The hard numbers behind the utilization plateau
National utilization, the percentage of time an average port spends actively charging a vehicle, sat at 15.9 percent in the third quarter, according to industry tracking, which draws data from the vast majority of public fast chargers in the country. That figure has stayed in a narrow band for five straight quarters.
Which means the network has grown its physical footprint substantially in recent years with charging sessions growing right alongside it, up 26 percent year over year to a record 50.4 million in the third quarter. That stability is itself notable, suggesting supply and demand are growing in lockstep rather than one racing ahead of the other.
Separate federal tracking backs up the growth trend. The count of public fast-charging ports showed the network growing by roughly 30 percent year over year earlier this year, a pace the newer quarterly data confirms continued into fall.
None of that growth is even. The gap between corridors stays wide, with the top 30 metro areas running at roughly 21 percent utilization against about 11 percent everywhere else, which is exactly what keeps the national average looking flat even as hot spots get genuinely crowded.
Where this plateau breaks down and who feels it first
Even so, a flat national number hides real financial pain at individual stations. Fast chargers are billed on both the electricity they use and their single highest demand spike each month, and that second charge does not care how often the plug sits idle.
Our earlier reporting found that a single charger can rack up thousands of dollars in monthly demand fees even when almost no cars plug in, because the bill is driven by the busiest quarter hour of the month. A quiet station with a few powerful chargers can lose money even while a similar busy one thrives.
That is the real split behind the headline number. Crowded corridor stations are profitable enough to justify every added stall.
Thinly used rural and suburban sites increasingly operate at a loss the moment the utility bill lands. Operators building bigger sites are betting those losses concentrate in specific weak spots on the map rather than spreading evenly.
What the plateau means for drivers and the next building wave
For an ordinary driver, flat utilization alongside rising sessions is reassuring rather than alarming. It means that even as more EVs hit the road and charging demand climbs, the odds of finding an open stall at a busy highway stop are not getting dramatically worse anytime soon.
So the building wave underway now looks less like a bubble and more like planned headroom for a market that still expects millions more electric vehicles in coming years. Operators would rather eat a few soft quarters than get caught short when demand finally catches up.
That calculation echoes what has played out elsewhere on the grid, where record summer peaks already raised stakes for managing charging load at scale.
What remains open is how long operators can keep absorbing thin margins at quiet sites before the industry consolidates around the busiest corridors. For now, the bigger stations keep rising, and the next year of data will decide which bet was right.
